The EUR/USD currency pair
المؤشرات الفنية لأزواج العملات:
- الافتتاح السابق: 1.0782
- الإغلاق السابق: 1.0834
- تغيُّر بنسبة% خلال اليوم الماضي: +0.48 %
Friday’s weakening of the dollar was a positive factor for the euro. On Friday, the euro gained 0.48% and reached a new 4-month high. In addition, the upward revision of the Eurozone’s Q4 GDP data is bullish for EUR/USD. Eurozone Q4 GDP was revised upward to 0.2% QoQ and 1.2% YoY from the previously announced 0.1% QoQ and 0.9% YoY. More and more ECB policymakers are beginning to lean toward the view that the ECB should be increasingly cautious about further interest rate cuts. However, the swaps market shows the opposite picture: swaps estimate the odds of a 25bp ECB rate cut at the April 17 meeting at 61%.
توصيات التداول
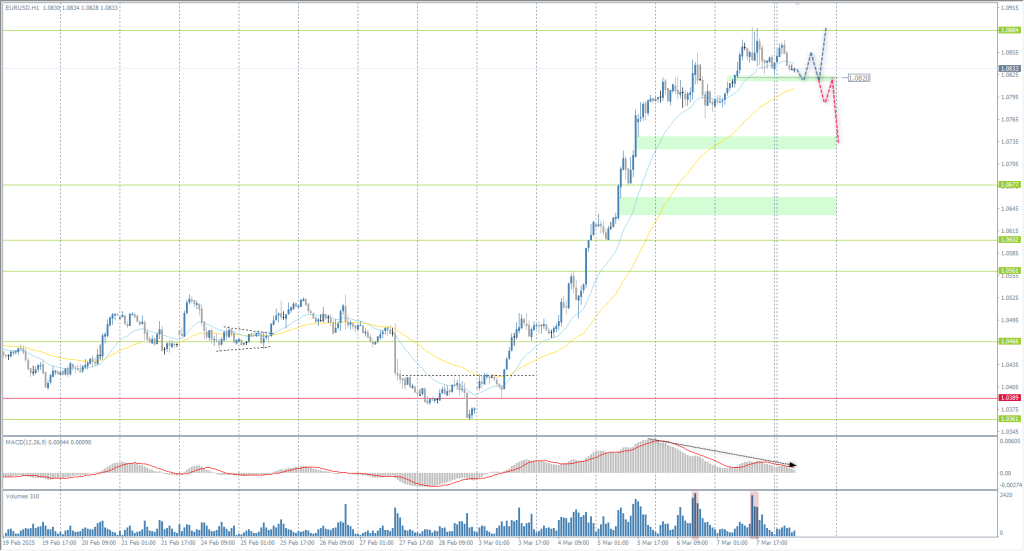
- مستويات الدعم: 1.0820, 1.0677, 1.0602, 1.0561, 1.0466
- مستويات المقاومة: 1.0884
The EUR/USD currency pair’s hourly trend is bullish. The euro reached the resistance level of 1.0884, where there is a partial fixation of previously opened purchases. The upward momentum is fading. Volume spikes are observed at the top. Considering the background of MACD divergence formation, we can look to sell deals from 1.0884, but with minimal risk, as the deal is against the trend. It is important to evaluate the price reaction to the support level at 1.0820. If buyers react here, the price may retest 1.0884. If buyers do not react here and the price consolidates below, the probability of a deeper correction will increase sharply.
السيناريو البديل:if the price breaks through the support level of 1.0389 and consolidates below it, the downtrend will likely resume.

موجز أخبار: 2025.03.10
- German Industrial Production (m/m) at 09:00 (GMT+2);
- German Trade Balance (m/m) at 09:00 (GMT+2).
The GBP/USD currency pair
المؤشرات الفنية لأزواج العملات:
- الافتتاح السابق: 1.2878
- الإغلاق السابق: 1.2922
- تغيُّر بنسبة% خلال اليوم الماضي: +0.34 %
Europe’s defense needs may improve the cooperation between the UK and the EU after Brexit. This is already contributing to sterling’s appreciation. Sterling’s 2.65% rally last week was the largest since November 2022. It was the fourth weekly rise in the last five weeks. There is little data on the UK economic calendar ahead of the release of the January GDP report on Friday. As for monetary policy, there is little chance of a rate cut at the BoE meeting on March 20, but the swaps market estimates the probability of a rate cut at the May 8 meeting at around 80%.
توصيات التداول
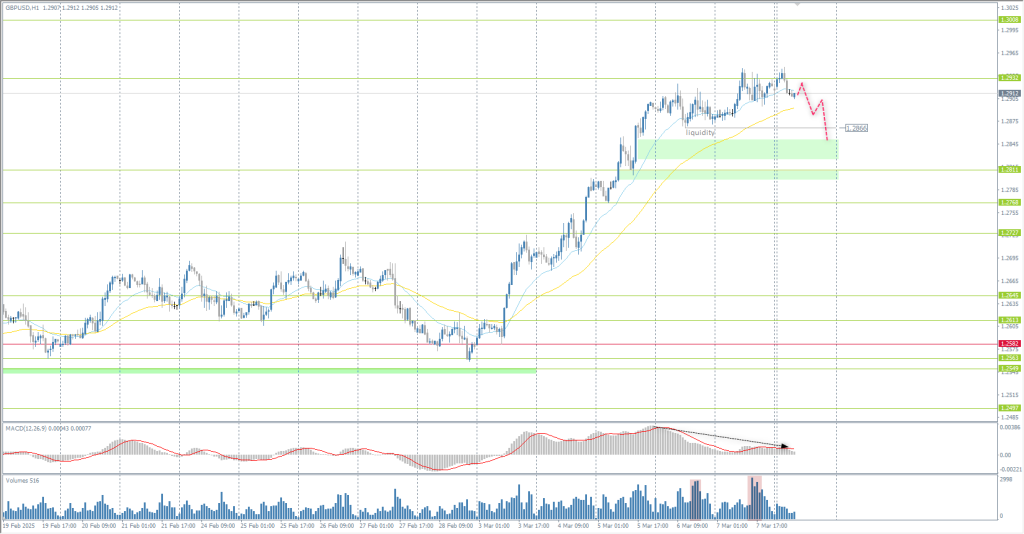
- مستويات الدعم: 1.2866, 1.2811, 1.2768, 1.2704, 1.2645
- مستويات المقاومة: 1.2932, 1.3008
From the point of view of technical analysis, the trend on the GBP/USD currency is bullish. The British pound has reached the resistance level of 1.2932. Technical indicators are overheated: MACD indicates divergence. A technical correction is looming. For selling, 1.2932 can be considered, but with minimal risk. For buying, it is best to consider EMA lines or support level 1.2866, but also with confirmation in the form of price reaction.
السيناريو البديل:if the price breaks the support level of 1.2582 and consolidates below it, the downtrend will likely resume.

موجز أخبار: 2025.03.10
The USD/JPY currency pair
المؤشرات الفنية لأزواج العملات:
- الافتتاح السابق: 147.97
- الإغلاق السابق: 148.05
- تغيُّر بنسبة% خلال اليوم الماضي: +0.05 %
On Friday, the yen retreated from the 5-month high against the USD after the rise in T-note yields caused the liquidation of long positions in the yen. The yen was also pressured by a Bloomberg report that said the Bank of Japan favors keeping interest rates unchanged at its policy meeting on March 18-19, as growing uncertainty in the global economy requires closer monitoring and analysis.
توصيات التداول
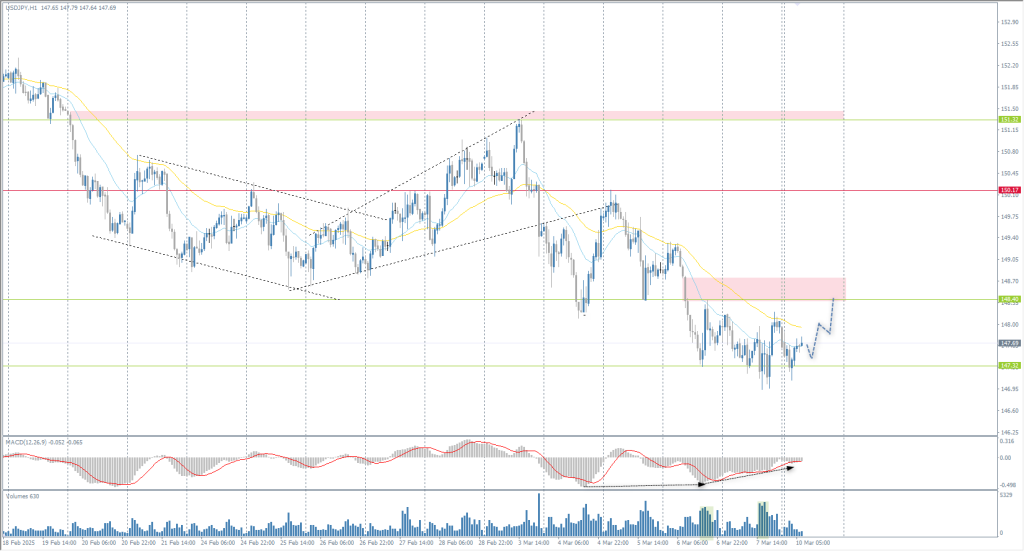
- مستويات الدعم: 147.32
- مستويات المقاومة: 148.40, 149.24, 150.16, 151.29, 152.32
From a technical point of view, the medium-term trend of the USD/JPY currency pair is bearish. But the reaction to the volume spike and the divergence on the MACD indicator indicates a high probability of a technical correction. Currently, the price will seek to test the liquidity above 148.40. Inside the day, we can look for buying up to this level, but with confirmation in the form of a reaction from the buying side. There are no optimal entry points for selling now.
السيناريو البديل:if the price breaks above the resistance at 151.29, the uptrend will likely resume.

موجز أخبار: 2025.03.10
The XAU/USD currency pair (gold)
المؤشرات الفنية لأزواج العملات:
- الافتتاح السابق: 2912
- الإغلاق السابق: 2912
- تغيُّر بنسبة% خلال اليوم الماضي: 0.0 %
Gold traded near $2910 per ounce on Friday, remaining near record highs as investors reacted to weaker-than-expected employment data. The latest non-farm payrolls report showed that the US economy added 151,000 jobs in February, slightly short of expectations of 160,000. At the same time, the unemployment rate unexpectedly rose to 4.1% and wage growth increased to 4%. The precious metal posted a weekly gain of 1.8%, helped by its appeal as a “safe-haven” currency amid changes in global trade policy. Although President Donald Trump slapped 25% tariffs on most goods from Canada and Mexico, Canada’s retaliatory tariffs remain in place and China’s measures will take effect next week.
توصيات التداول
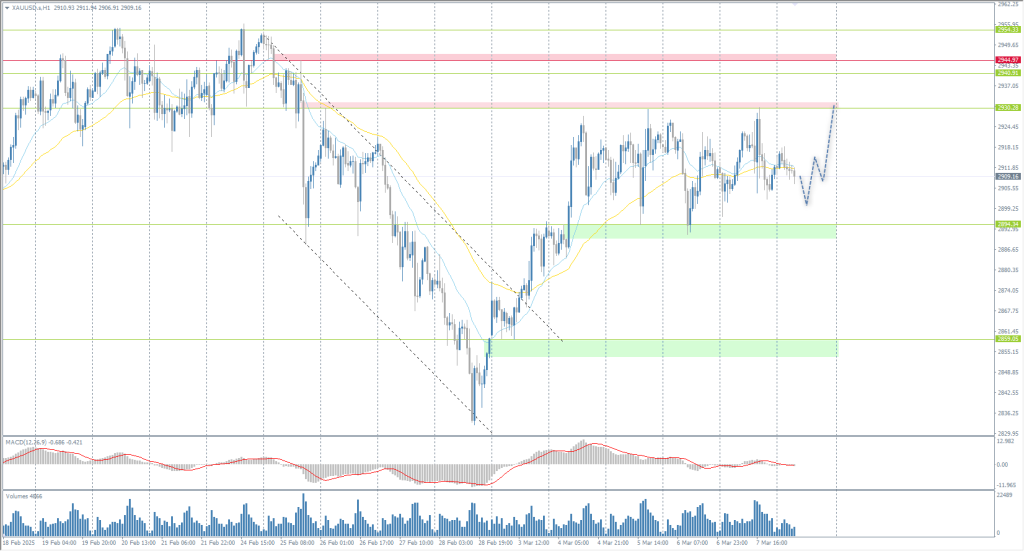
- مستويات الدعم: 2894, 2859, 2833
- مستويات المقاومة: 2930, 2940, 2944
From the point of view of technical analysis, the trend on the XAU/USD is bearish, but fundamental conditions for further growth are forming. Gold is now forming a broadly volatile corridor with the boundaries of 2894-2930. After Friday’s test of the upper boundary, the price will seek to test the lower boundary of the flat. However, currently, the price is in the center of the flat, so there are no optimal entry points.
السيناريو البديل:if the price breaks and consolidates above the resistance at 2945, the uptrend will likely resume.

لا يوجد أخبار اليوم
هذه المقالة تُعبِّر عن رأي شخصي ولا ينبغي تفسيرها على أنها نصيحة استثمارية، و/أو عرض، و/أو طلب مُلِح لإجراء معاملات مالية، و/أو ضمان لشيء، و/أو توقع للأحداث المستقبلية.
