The EUR/USD currency pair
Technical indicators of the currency pair:
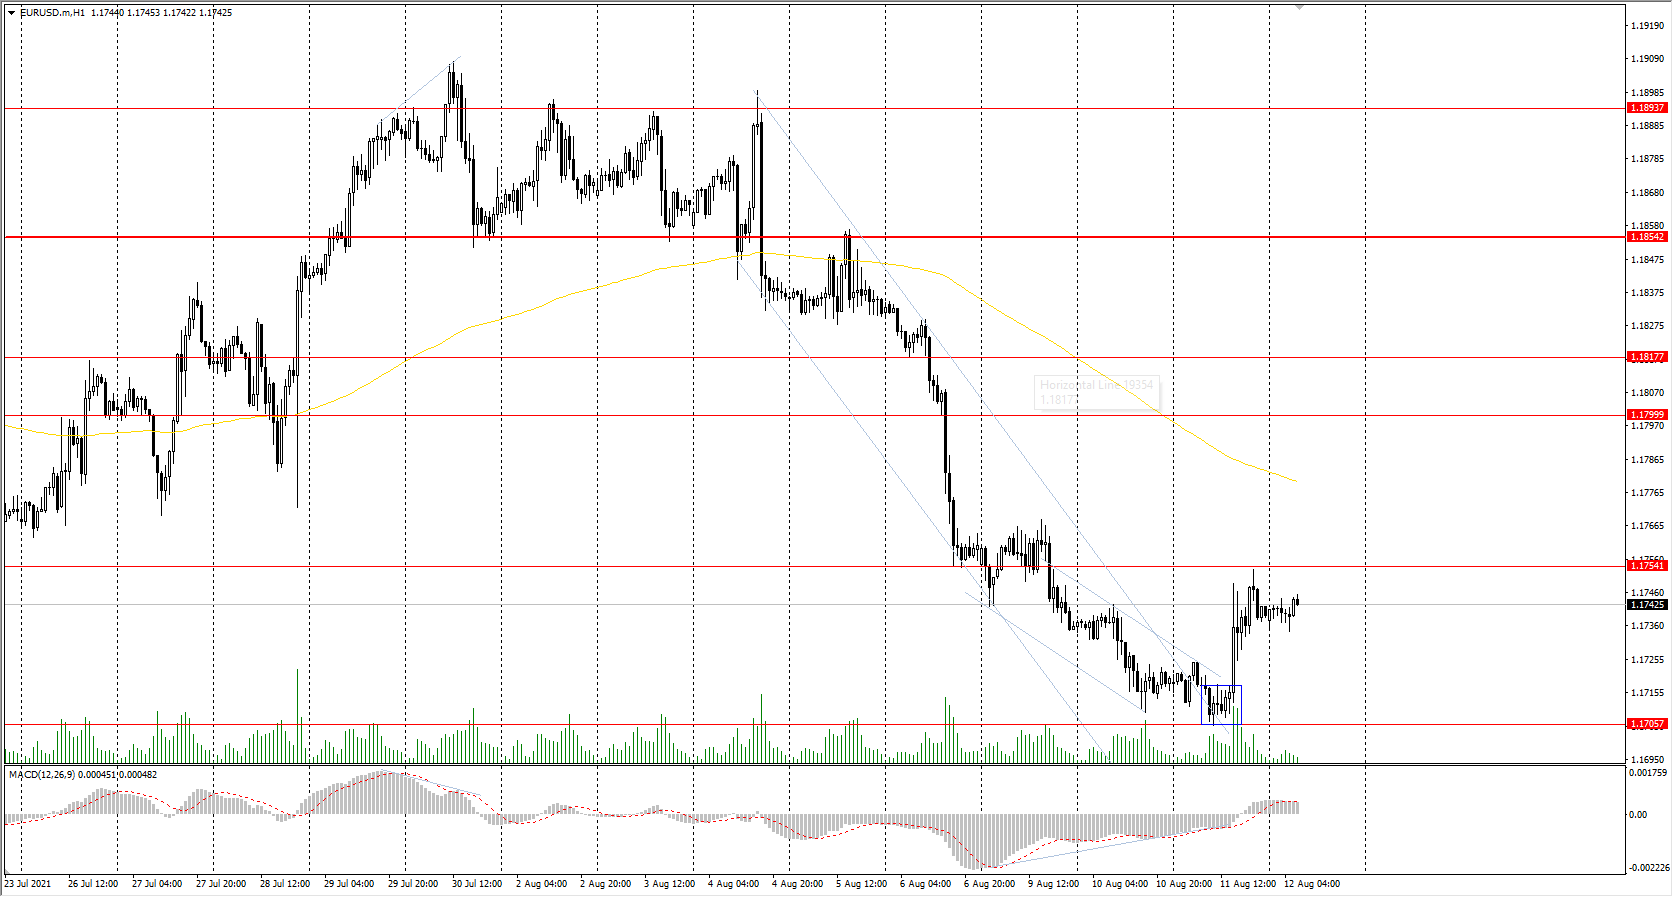
- Prev. Open: 1.1719
- Prev. Close: 1.1739
- % chg. over the last day: +0.17%
During the news release about the dollar index decline, the European currency, which has an inverse correlation with the US dollar, increased by 0.17% yesterday. But European inflation data is still weak. Germany annual inflation rate increased from 2.3% to 3.8% in July, which is in line with economists’ forecasts, but inflation is still rising.
Trading recommendations
- Support levels: 1.1706,1.1609
- Resistance levels: 1.1754,1.1799,1.1817,1.1854,1.1894,1.1934,1.1969
From a technical point of view, the general trend on the EUR/USD currency pair is bearish. But the price showed a bullish initiative from the daily support level yesterday. Under such market conditions, it is best to look for the sell trades from the resistance levels near the moving average. Buy trades can only be considered throughout the day from the zone where the buyers showed initiative.
Alternative scenario:if the price breaks through the 1.1854 resistance level and fixes above, the mid-term uptrend will likely resume.
News feed for: 2023.07.04
- Eurozone Industrial Production (m/m) at 12:00 (GMT+3);
- US Producer Price Index (m/m) at 15:30 (GMT+3);
- US Initial Jobless Claims (w/w) at 15:30 (GMT+3).
The GBP/USD currency pair
Technical indicators of the currency pair:
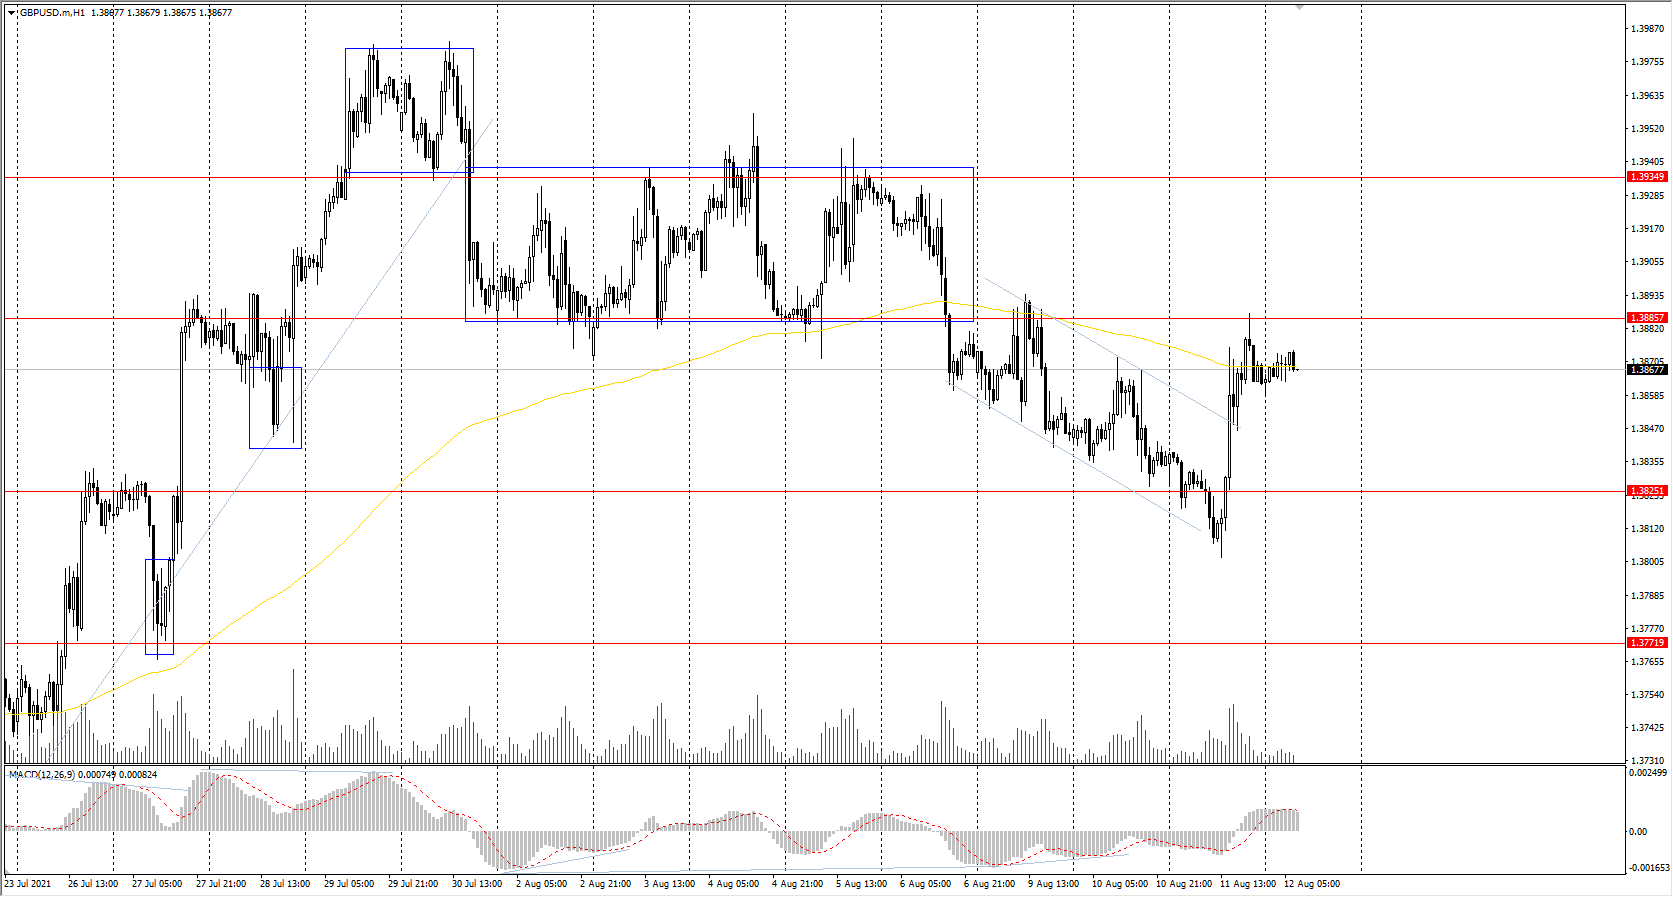
- Prev. Open: 1.3835
- Prev. Close: 1.3864
- % chg. over the last day: +0.21%
Yesterday, the British currency added 0.21% amid the temporary weakness of the dollar index. There will be a lot of important macroeconomic statistics in the UK today. Good data may lead to the growth of the GBP/USD quotes.
Trading recommendations
- Support levels: 1.3825,1.3772,1.3714,1.3676,1.3641,1.3614,1.3525
- Resistance levels: 1.3886,1.3935,1.4002,1.4075,1.4101
The trend of the GBP/USD currency pair is bullish on the hourly time frame. The price rebounded from the support level and broke through the local descending channel. The MACD indicator has become positive. Under such market conditions, traders are better to look for the buy trades from the zone where the buyers showed initiative. Sell positions can be considered from the resistance levels and only on intraday timeframes.
Alternative scenario:if the price breaks through the 1.3714 support level and consolidates below, the bearish scenario is likely to resume.
News feed for: 2023.07.04
- UK Industrial Production (m/m) at 09:00 (GMT+3);
- UK Manufacturing Production (m/m) at 09:00 (GMT+3).
The USD/JPY currency pair
Technical indicators of the currency pair:
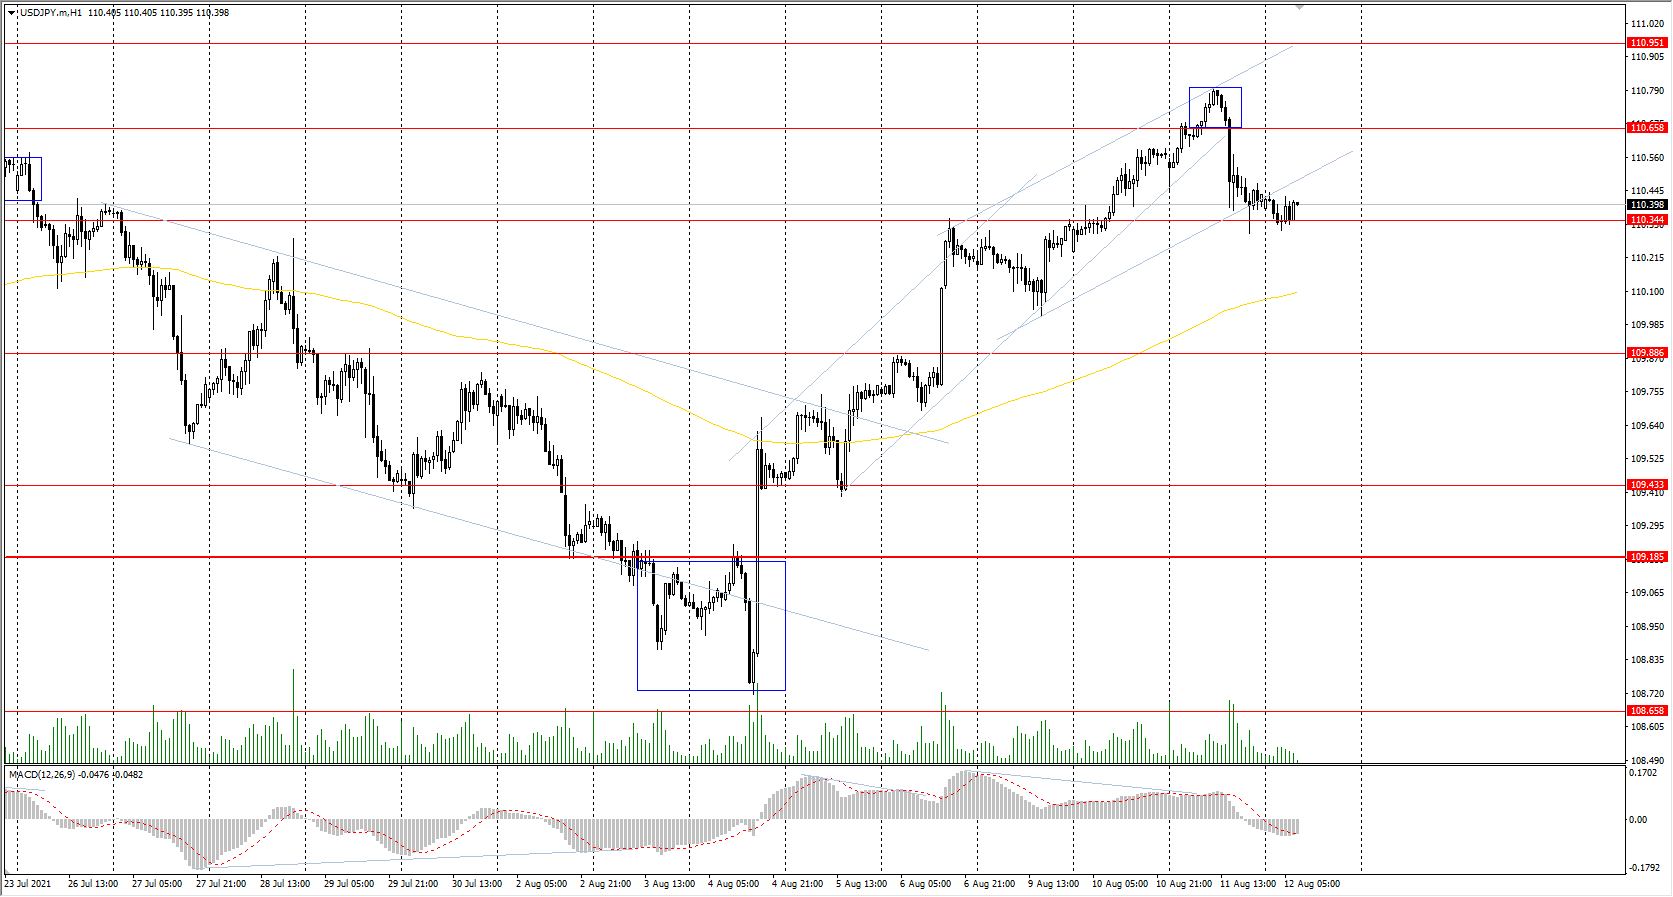
- Prev. Open: 110.54
- Prev. Close: 110.43
- % chg. over the last day: -0.10%
Trading recommendations
No news for today
The USD/JPY currency pair decreased by 0.1% due to a drop in the dollar index. Japan’s industrial production index increased from 5.0% to 5.6% on a year-on-year basis. It’s better than economists’ forecasts, but the overall Q3 fundamental forecast for Japan remains weak.
Technical indicators of the currency pair:
The USD/JPY currency pair decreased by 0.1% due to a drop in the dollar index. Japan’s industrial production index increased from 5.0% to 5.6% on a year-on-year basis. It’s better than economists’ forecasts, but the overall Q3 fundamental forecast for Japan remains weak.
Trading recommendations
- Support levels: 110.34,109.88,109.43,109.19,108.65
- Resistance levels: 110.66,110.95,111.48
The main trend on the USD/JPY currency pair is bullish. The MACD indicator went below zero. Under such market conditions, it is better to look for the buy positions from the support level near the moving average. Sell positions should be considered only on the lower time frames from the zone where the sellers showed initiative.
Alternative scenario:if the price falls below 109.19, the uptrend is likely to be broken.
News feed for: 2023.07.04
- Japan Industrial Production (m/m) at 07:30 (GMT+3).
The USD/CAD currency pair
Technical indicators of the currency pair:
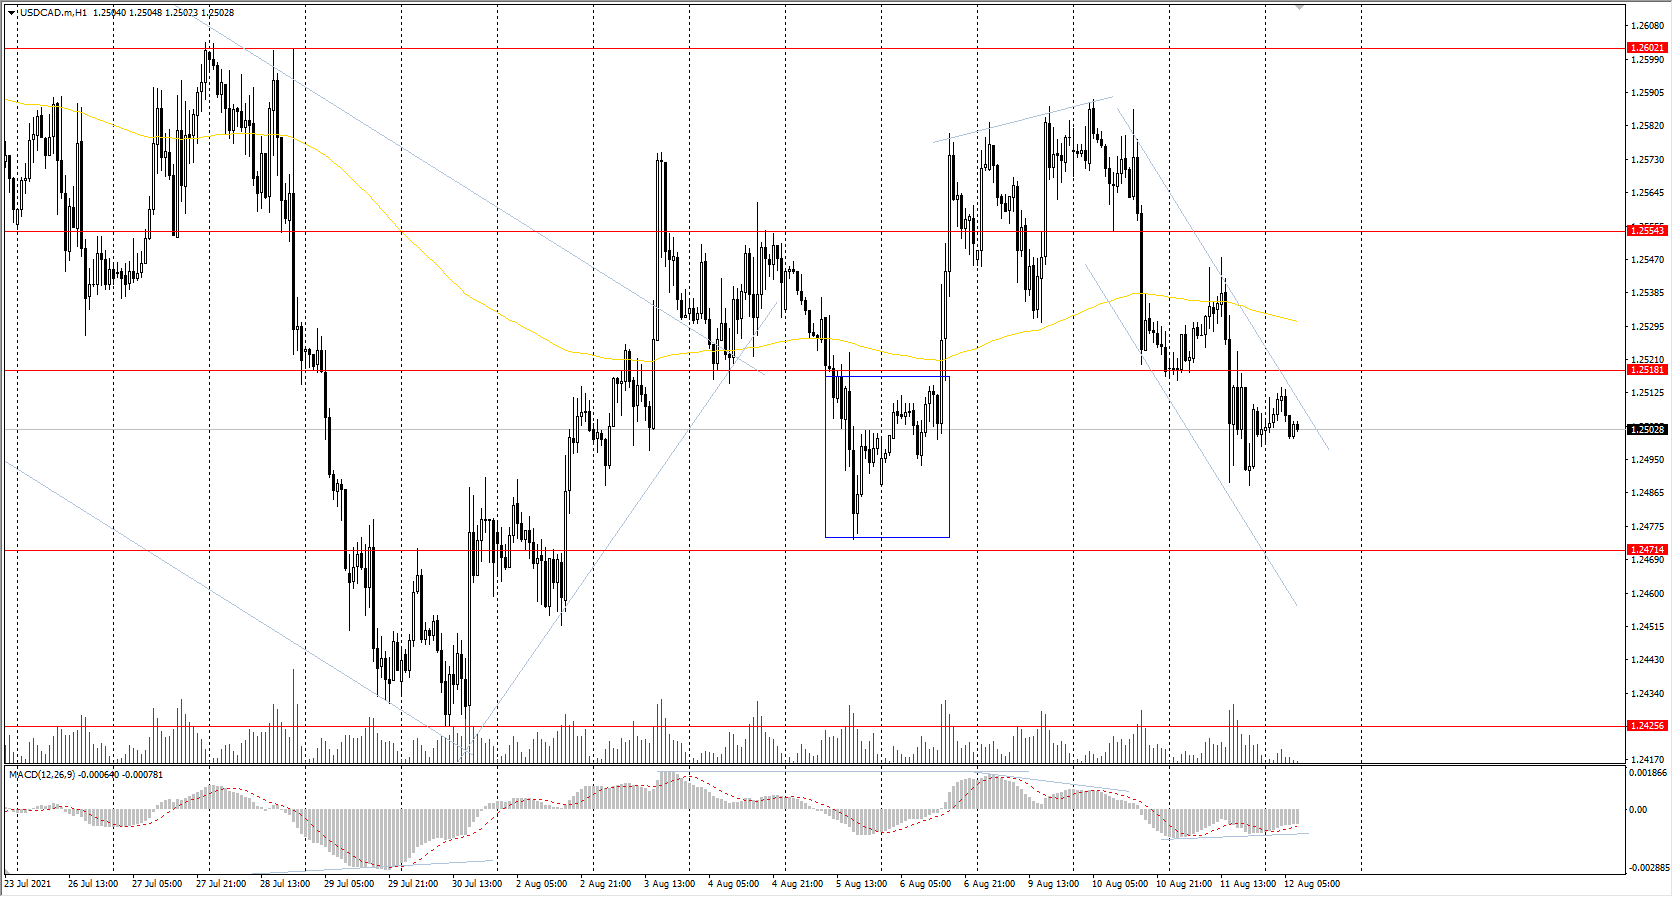
- Prev. Open: 1.2519
- Prev. Close: 1.2503
- % chg. over the last day: -0.13%
The Canadian dollar is highly dependent on the performance of the dollar index and oil price performance. Yesterday, the decrease in the dollar index and the rise in oil prices caused a strengthening of the Canadian dollar and a decrease in the USD/CAD quotes.
Trading recommendations
- Support levels: 1.2471,1.2425,1.2370,1.2312
- Resistance levels: 1.2518,1.2554,1.2602,1.2671,1.2787,1.2951
Considering technical analysis, the USD/CAD trend is bearish. The price went below the moving average, and the MACD indicator shows signs of divergence. Under such market conditions, it is better to look for the sell positions from the resistance levels. Traders should consider the buy positions from the support levels and only on intraday time frames.
Alternative scenario:if the price breaks through the 1.2671 resistance level and fixes above, the uptrend is likely to be resumed.
No news for today
This article reflects a personal opinion and should not be interpreted as an investment advice, and/or offer, and/or a persistent request for carrying out financial transactions, and/or a guarantee, and/or a forecast of future events.