The EUR/USD currency pair
Technical indicators of the currency pair:
- Prev. Open: 1.1345
- Prev. Close: 1.1283
- % chg. over the last day: -0.55 %
The European Central Bank will hold a policy meeting on Thursday, and the markets generally expect a 25 basis points rate cut. Investors will be watching closely for comments from ECB officials on the impact of trade tensions on the Eurozone economy and the future path of interest rates. The ZEW economic sentiment indicator for Germany in April 2025 fell to 14, the lowest level since July 2023, from 51.6 in March, and well below expectations of 9.5. Unpredictable changes in US trade policy continue to weigh heavily on sentiment.
Trading recommendations
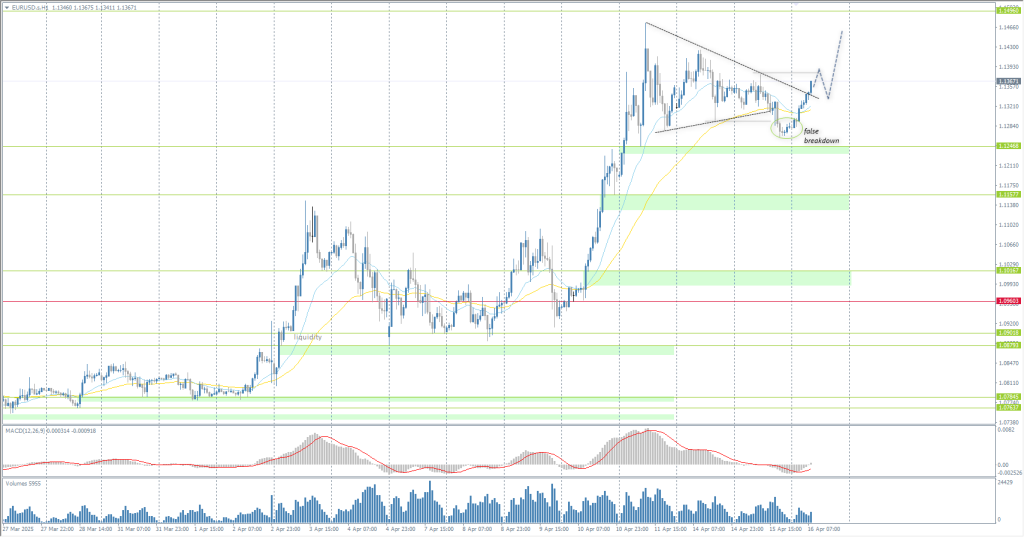
- Support levels: 1.1246, 1.1157, 1.1088, 1.0960
- Resistance levels: 1.1496
The EUR/USD currency pair’s hourly trend is bullish. The euro formed a false breakdown yesterday, and the price is consolidating above the downtrend line now. We can consider the EMA lines or the breakout point of the trendline for buying. The profit target is to renew the high of the week. There are no optimal entry points for selling right now.
Alternative scenario:if the price breaks the support level of 1.0960 and consolidates below it, the downtrend will likely resume.

News feed for: 2025.04.16
- Eurozone Consumer Price Index (m/m) at 12:00 (GMT+3);
- US Retail Sales (m/m) at 15:30 (GMT+3);
- US Industrial Production (m/m) at 16:15 (GMT+3).
The GBP/USD currency pair
Technical indicators of the currency pair:
- Prev. Open: 1.3184
- Prev. Close: 1.3231
- % chg. over the last day: -0.35 %
The British pound sterling climbed above $1.32, hitting a six-month high, as markets reacted to labor market data and the Bank of England’s (BoE) change in expectations. While private sector wage growth remains strong at 5.9%, employment fell sharply in March, hinting at weakness in the economy. A strengthening pound and weaker global demand due to trade disruptions could ease inflationary pressures in the near term, but expected spikes in energy and regulated commodity prices later this year complicate the Bank of England’s path. Investors are betting on a faster rate cut even as inflation risks persist.
Trading recommendations
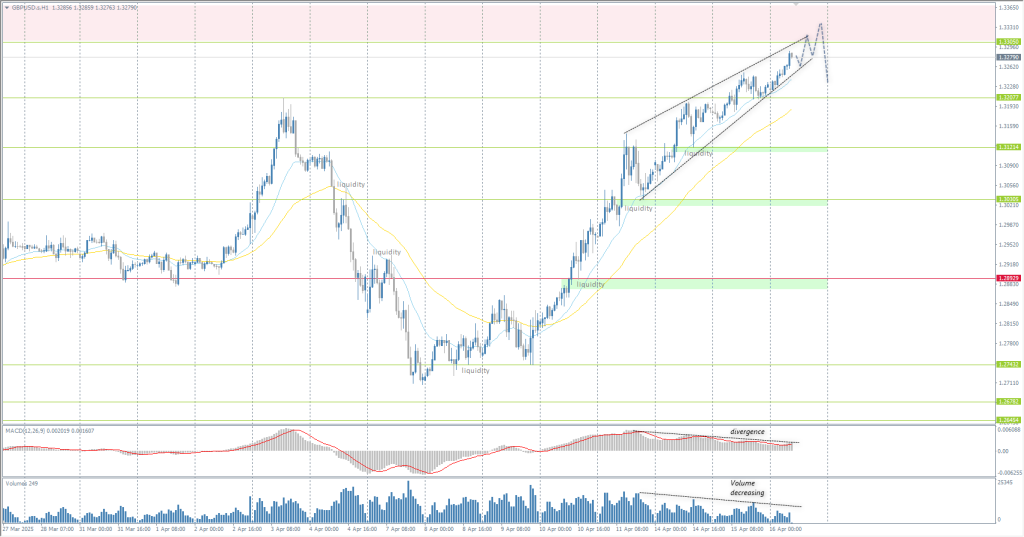
- Support levels: 1.3207, 1.3121, 1.3030, 1.2891, 1.2743
- Resistance levels: 1.3305, 1.3290
In terms of technical analysis, the trend on the currency pair GBP/USD on the hourly time frame has changed to an upward trend. Sterling did not react to the resistance level of 1.3207 and now seeks to test the liquidity above 1.3305. Fixation of previously opened purchases is likely here. Considering the MACD divergence and falling volumes, the price may correct to 1.3207. Intraday buying can be considered, but with small volumes.
Alternative scenario:if the price breaks the resistance level of 1.3114 and consolidates above it, the uptrend will likely resume.

News feed for: 2025.04.16
- UK Consumer Price Index (m/m) at 09:00 (GMT+3).
The USD/JPY currency pair
Technical indicators of the currency pair:
- Prev. Open: 143.00
- Prev. Close: 143.20
- % chg. over the last day: -0.14 %
The Bank of Japan (BoJ) may consider taking policy measures if the US tariffs hurt the Japanese economy, BoJ Governor Kazuo Ueda said. Ueda acknowledged that recent developments are already weighing on corporate and household sentiment. While the BoJ still plans to raise rates at an “appropriate pace,” Ueda emphasized the importance of assessing the economic impact of US tariffs without bias. The governor added that domestic food inflation is likely to ease, real wages are expected to rise in the middle of the year, and both upside and downside risks remain for the inflation outlook. The Bank of Japan will hold a monetary policy meeting on April 30–May 1.
Trading recommendations
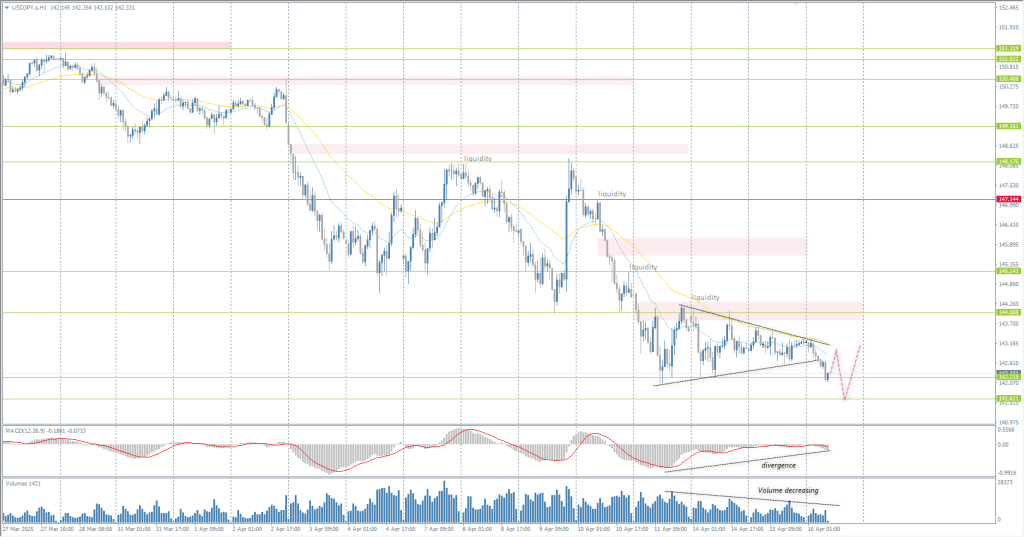
- Support levels: 142.21, 141.61, 140.45
- Resistance levels: 144.08, 145.14, 147.14
From a technical point of view, the medium-term trend of the USD/JPY currency pair is bearish. The yen has reached the support level of 142.20. The MACD divergence is getting stronger, and falling volumes indicate the lack of activity (interest). Most likely, after a liquidity test below 141.61, the price will start to correct, forming a flat accumulation. For buying, 141.61 can be considered, provided there is a bullish reaction. There are no optimal entry points for selling right now.
Alternative scenario:if the price breaks through the resistance level at 147.14 and consolidates above it, the uptrend will likely resume.

No news for today
The XAU/USD currency pair (gold)
Technical indicators of the currency pair:
- Prev. Open: 3211
- Prev. Close: 3230
- % chg. over the last day: +0.59 %
Gold climbed to $3,280 per ounce on Wednesday, setting a new record, as ongoing uncertainty over US trade policy continues to support demand for safe-haven metals along with a generally weaker dollar. On Tuesday, President Trump called for an investigation into potential tariffs on imports of all major minerals, a move that signals a tougher trade stance and could affect relations with key suppliers, including China. This development partially offsets market relief from the recent exclusion of certain technology goods from reciprocal tariffs and indications of possible exemptions for auto parts. In addition, major banks remain positive on the outlook for gold, citing continued inflows into gold-backed ETFs and steady Central Bank buying.
Trading recommendations
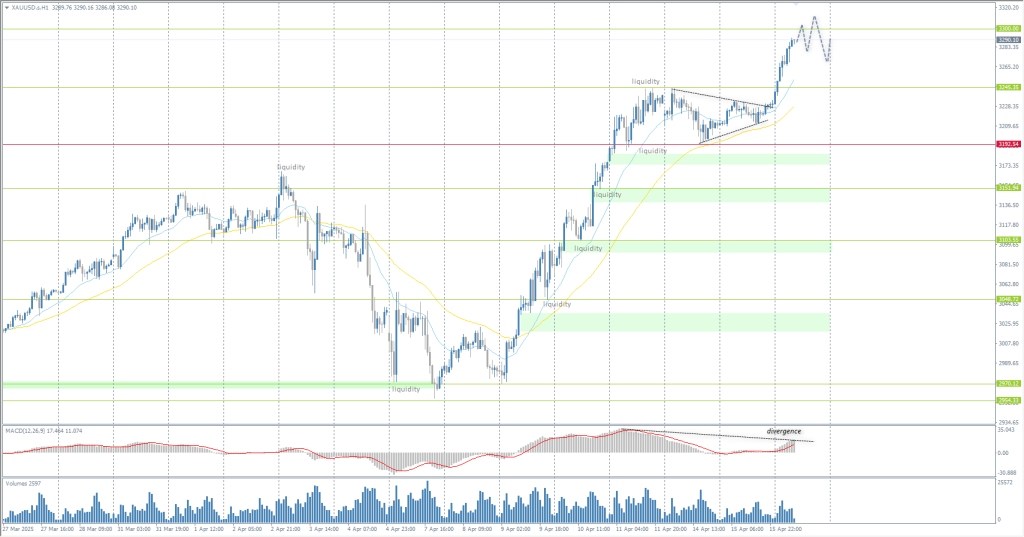
- Support levels: 3192, 3152, 3103, 3048, 3035
- Resistance levels: 3300
From the point of view of technical analysis, the trend on the XAU/USD is bullish. Gold continues its rally. The price is aiming for the round psychological level of 3300. The MACD divergence is getting stronger, which limits the potential, but without a bearish reaction, selling should not be rushed. There are also no optimal entry points for buying, as the price has deviated strongly from the moving lines.
Alternative scenario:if the price breaks and consolidates below the support level of 3192, the downtrend will likely resume.

News feed for: 2025.04.16
- US Retail Sales (m/m) at 15:30 (GMT+3);
- US Industrial Production (m/m) at 16:15 (GMT+3).
This article reflects a personal opinion and should not be interpreted as an investment advice, and/or offer, and/or a persistent request for carrying out financial transactions, and/or a guarantee, and/or a forecast of future events.
