The EUR/USD currency pair
Technical indicators of the currency pair:
- Prev. Open: 1.1423
- Prev. Close: 1.1317
- % chg. over the last day: -0.93 %
On Wednesday, the strengthening dollar pressured the euro. In addition, comments from ECB Governing Council representative Nagel were negative for the euro when he stated that Europe is “in a situation of stagnation” due to the effects of US tariffs. Euro losses accelerated on Wednesday due to dovish comments from ECB Governing Council representative Villeroy de Galhau, who stated that he sees no inflationary risks and that further ECB rate cuts are likely. A positive factor for the Euro was Wednesday’s news, according to which the S&P Eurozone Manufacturing PMI for April unexpectedly rose to a 2-year high.
Trading recommendations
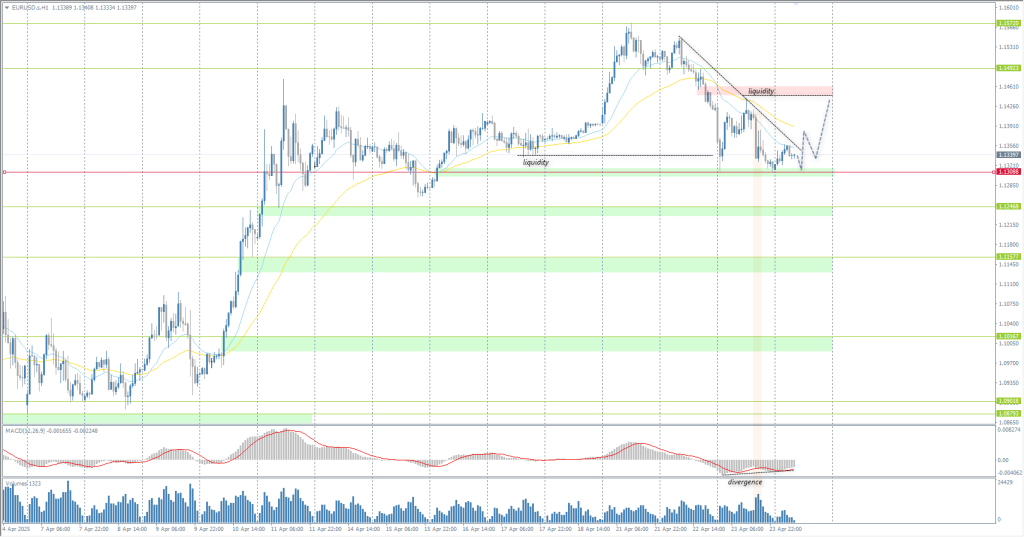
- Support levels: 1.1331, 1.1246, 1.1157, 1.1088, 1.0960
- Resistance levels: 1.1403, 1.1492, 1.1572
The EUR/USD currency pair’s hourly trend is bullish. The euro corrected to the priority change level. Yesterday, buyers took the initiative on liquidity below this level. This means that this liquidity should now be allocated higher. Therefore, intraday today it is appropriate to look for buy trades from 1.1331. There are no optimal entry points for selling right now.
Alternative scenario:if the price breaks the support level of 1.1335 and consolidates below it, the downtrend will likely resume.

News feed for: 2025.04.24
- German IFO Business Climate (m/m) at 11:00 (GMT+3);
- US Durable Goods Orders (m/m) at 15:30 (GMT+3);
- US Initial Jobless Claims (w/w) at 15:30 (GMT+3);
- US Existing Home Sales (m/m) at 17:00 (GMT+3).
The GBP/USD currency pair
Technical indicators of the currency pair:
- Prev. Open: 1.3331
- Prev. Close: 1.3254
- % chg. over the last day: -0.58 %
The UK Manufacturing Activity Index fell from 44.9 to 44.0 in April. Activity in the services sector also fell from 52.5 to 48.9, indicating a contraction in the sector (indicator below 50). Such negative data increases the probability of a rate cut from the Bank of England at the upcoming meetings, which puts pressure on the pound sterling.
Trading recommendations
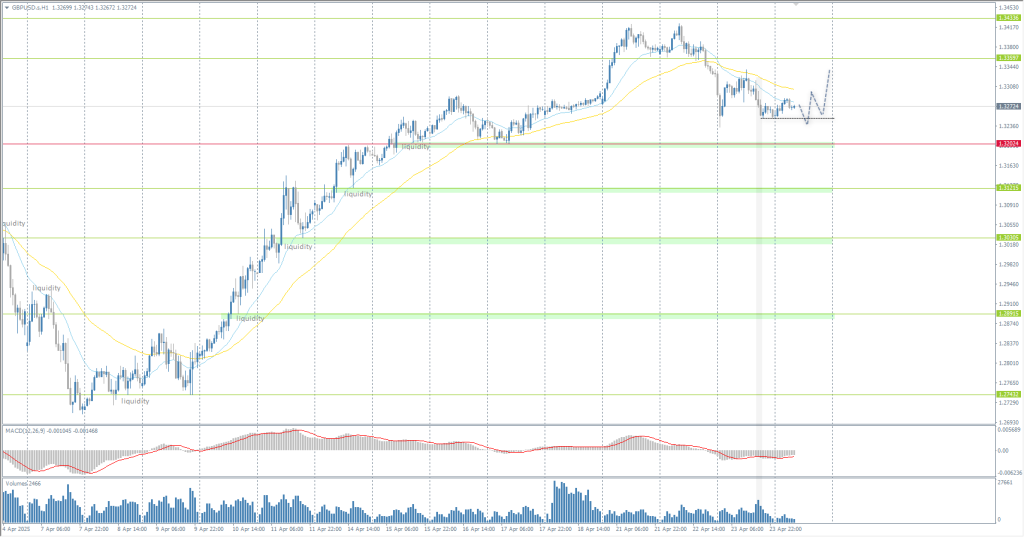
- Support levels: 1.3202, 1.3121, 1.3030, 1.2891, 1.2743
- Resistance levels: 1.3357, 1.3434
In terms of technical analysis, the trend on the currency pair GBP/USD on the hourly time frame is bullish. The British pound, following the euro, also corrected on the growth of the US dollar Index. However, the pound, unlike the euro, did not reach the support level. This is called SMT-divergence between instruments, and it is usually a harbinger of a reversal. For buying, it is best to consider the intraday support level of 1.3250. For selling, evaluate the price reaction to the resistance level of 1.3360.
Alternative scenario:if the price breaks the resistance level of 1.3202 and consolidates above it, the uptrend will likely resume.

No news for today
The USD/JPY currency pair
Technical indicators of the currency pair:
- Prev. Open: 141.53
- Prev. Close: 143.48
- % chg. over the last day: +1.38 %
Japanese banks should monitor various risks associated with high levels of uncertainty over global trade policy, the Bank of Japan said on Wednesday, as US President Donald Trump’s tariffs have rattled financial markets in recent weeks. Increased communication between Japanese banks and foreign non-banks suggests Japan’s financial system has become more susceptible to fluctuations in global financial markets and the influence of the foreign non-banking sector.
Trading recommendations
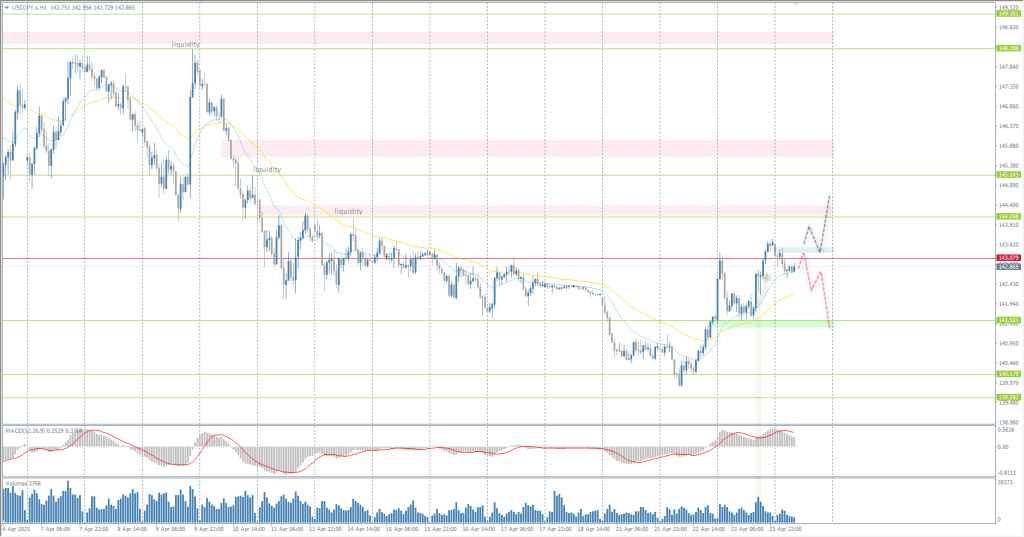
- Support levels: 141.52, 140.18, 139.59
- Resistance levels: 143.08, 144.09
From a technical point of view, the medium-term trend of the USD/JPY currency pair is bearish. The Japanese yen corrected to the level of priority change and consolidated above the EMA lines. The probability of the medium-term trend change has increased, but we should not hurry to buy, as sellers are still reacting to the resistance level of 143.08. Buying can be considered from the support level of 141.52 or after the price consolidates above 143.08.
Alternative scenario:if the price breaks through the resistance level at 143.08 and consolidates above it, the uptrend will likely resume.

No news for today
The XAU/USD currency pair (gold)
Technical indicators of the currency pair:
- Prev. Open: 3330
- Prev. Close: 3290
- % chg. over the last day: -1.21 %
The strengthening of the dollar on Wednesday caused pressure to liquidate long positions in precious metals. In addition, a sharp rally in equities on Wednesday limited demand for precious metals amid optimism in the trade war between the US and China after President Trump said he plans to be “very nice” to China in any negotiations and that tariffs will be reduced if the two countries can reach a trade deal.
Trading recommendations
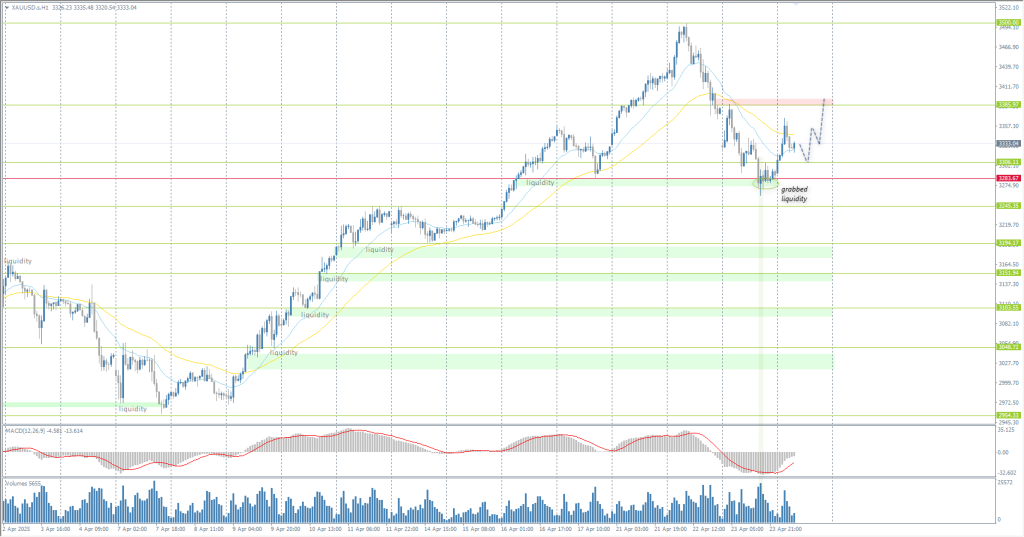
- Support levels: 3310, 3283, 3245, 3194
- Resistance levels: 3385, 3500
From the point of view of technical analysis, the trend on the XAU/USD is bullish. Gold corrected within the framework of profit-taking, but the correction was a bit deeper than initially expected. The price has reached the level of priority change — buyers took the initiative here, and now the grabbed liquidity is distributing to the resistance levels. The nearest such level is 3385. Inside the day, you can look for buy trades up to this level, but with a short stop. There are no optimal entry points for selling now.
Alternative scenario:if the price breaks and consolidates below the support level of 3283, the downtrend will likely resume.

News feed for: 2025.04.24
- German IFO Business Climate (m/m) at 11:00 (GMT+3);
- US Durable Goods Orders (m/m) at 15:30 (GMT+3);
- US Initial Jobless Claims (w/w) at 15:30 (GMT+3);
- US Existing Home Sales (m/m) at 17:00 (GMT+3).
This article reflects a personal opinion and should not be interpreted as an investment advice, and/or offer, and/or a persistent request for carrying out financial transactions, and/or a guarantee, and/or a forecast of future events.
