The EUR/USD currency pair
Technical indicators of the currency pair:
- Prev. Open: 1.1286
- Prev. Close: 1.1301
- % chg. over the last day: +0.13 %
Eurozone inflation remained unchanged at 2.2% in April, slightly higher than the expected 2.1%. Services inflation accelerated to 3.9%, while core inflation, excluding food and energy, rose to 2.7%, also beating expectations and prompting investors to maintain prognoses of a 60bp rate cut by the European Central Bank before the end of the year. In the US, Non-Farm Payroll employment rose by 177,000 in April, beating market expectations of 130,000, despite increased uncertainty surrounding President Trump’s tariff policy. Strong employment data combined with a weak GDP report on Wednesday could complicate the Federal Reserve’s decision on whether to cut interest rates in June.
Trading recommendations
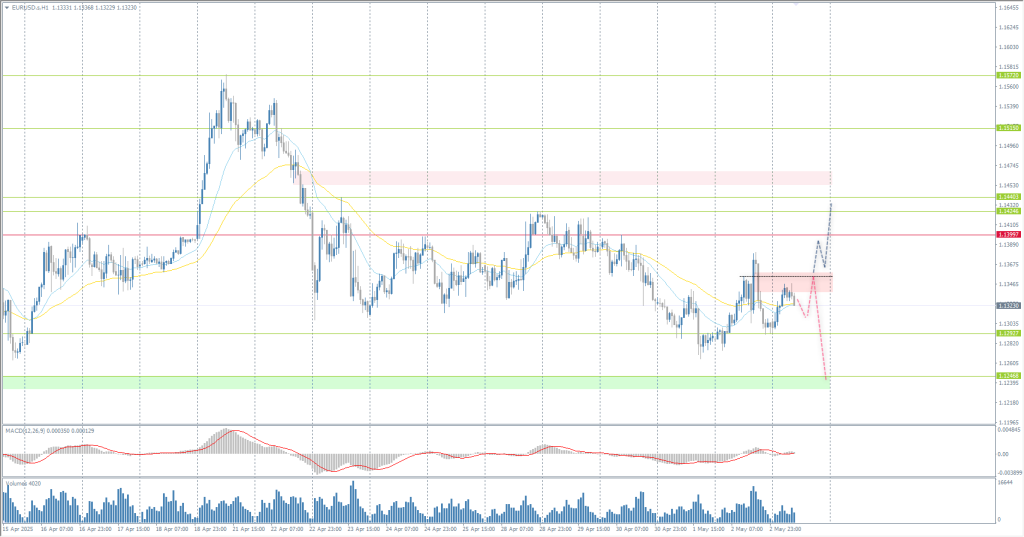
- Support levels: 1.1293, 1.1246, 1.1157, 1.1088, 1.0960
- Resistance levels: 1.1440, 1.1492, 1.1572
The EUR/USD currency pair’s hourly trend has changed to a downtrend. The euro has consolidated below the priority change level. Currently, the price seeks to test the liquidity pool below 1.1246. Selling can be sought from the resistance level of 1.1350, provided sellers react. It is worth returning to buying if the price consolidates above 1.1350.
Alternative scenario:if the price breaks the resistance level of 1.1340 and consolidates above it, the uptrend will likely resume.

News feed for: 2025.05.05
- US ISM Services PMI (m/m) at 17:00 (GMT+3).
The GBP/USD currency pair
Technical indicators of the currency pair:
- Prev. Open: 1.3276
- Prev. Close: 1.3271
- % chg. over the last day: -0.04 %
Sterling seems to benefit more from the weakening US dollar than from optimism regarding the UK’s economic performance. In addition, the postponement of reciprocal tariffs, which hit the EU harder than the UK, keeps things on a level playing field until July. The main event of the week will be the Bank of England meeting on May 8. The market is confident that it will decide on a quarter-point rate cut. The rate cut is fully discounted in the swap market. The swap market has almost 95 bps of rate cuts pledged for this year. This means that three-quarter-point rate cuts are fully expected and an 80% probability of a fourth. As recently as late March, even two rate cuts were not even considered.
Trading recommendations
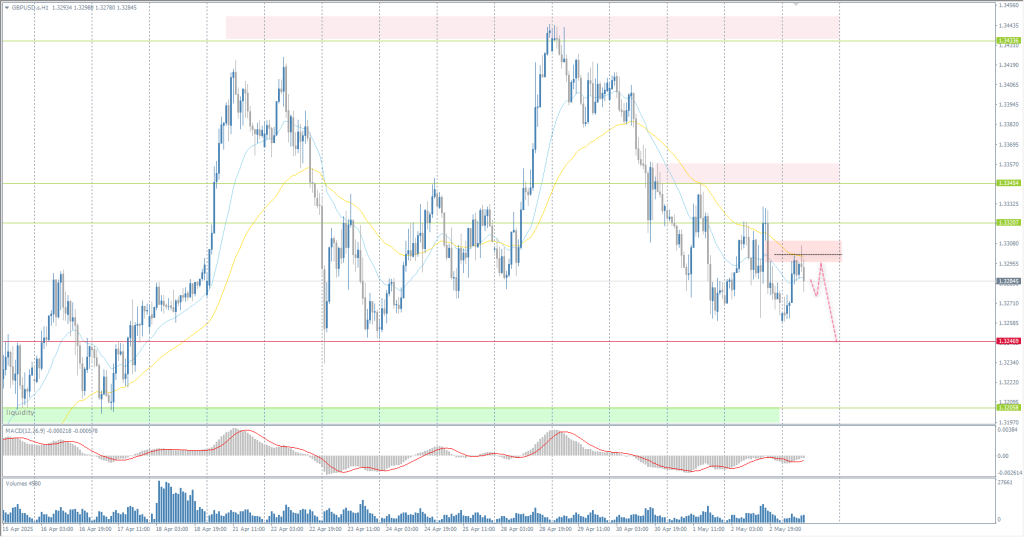
- Support levels: 1.3274, 1.3246, 1.3121
- Resistance levels: 1.3320, 1.3345, 1.3434
In terms of technical analysis, the trend on the currency pair GBP/USD on the hourly time frame is bullish. The British pound is correcting. Currently, the price is aiming to test the liquidity pool below 1.3247. Intraday, you can look for selling from the EMA lines. There are no optimal entry points for buying right now.
Alternative scenario:if the price breaks the resistance level of 1.3202 and consolidates above it, the uptrend will likely resume.

No news for today
The USD/JPY currency pair
Technical indicators of the currency pair:
- Prev. Open: 145.44
- Prev. Close: 144.92
- % chg. over the last day: -0.36 %
The Japanese yen rose to 144 per US dollar on Monday, extending gains from the previous session as the dollar weakened amid continued global trade uncertainty. Markets are also closely watching the outcome of recent bilateral trade talks between the US and Japan, with Tokyo aiming to agree by June. On the monetary policy front, the Bank of Japan left its policy rate unchanged at 0.5% last week, as expected. However, the Central Bank lowered its growth and inflation projections, which reinforced expectations that a rate hike is unlikely in the near term.
Trading recommendations
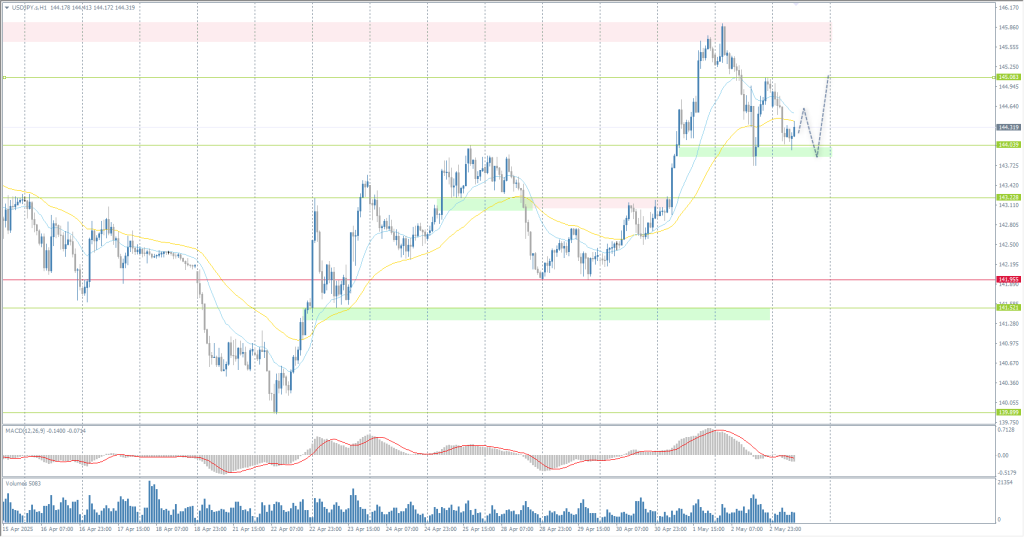
- Support levels: 144.03, 143.22, 142.26, 141.96, 140.18, 139.59
- Resistance levels: 145.08, 147.13
From a technical point of view, the medium-term trend of the USD/JPY is bullish. The Japanese yen has reached the FVG on the side of buyers. Here, we can consider buying from the support level of 144.03. The profit target is 145.08. A move below 144.03 will trigger a sell-off to the support level of 143.22.
Alternative scenario:if the price breaks the support level of 141.96 and consolidates below it, the downtrend will likely resume.

No news for today
The XAU/USD currency pair (gold)
Technical indicators of the currency pair:
- Prev. Open: 3241
- Prev. Close: 3240
- % chg. over the last day: -0.03 %
Gold rose above $3250 an ounce on Monday thanks to a weaker US dollar, with traders awaiting further clarity on US-China trade talks. President Donald Trump said on Sunday that he believes China wants a deal, but he did not provide any specifics or timeline. Meanwhile, investors are now turning their attention to this week’s US Federal Reserve meeting. The Central Bank is expected to leave interest rates unchanged, despite President Trump’s renewed calls for a rate cut.
Trading recommendations
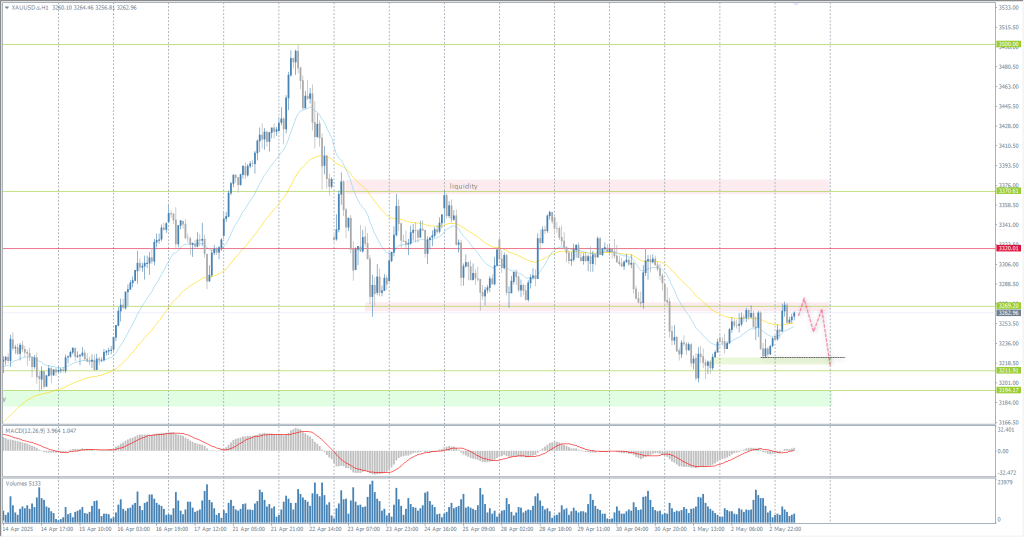
- Support levels: 3222, 3211, 3194
- Resistance levels: 3269, 3328, 3367, 3385, 3500
From the point of view of technical analysis, the trend on the XAU/USD is bearish. Gold reached the resistance level of 3269, where sellers showed a reaction. Here, we can look for sales with a target of up to 3222. A price consolidation above 3269 will trigger a buying wave up to 3220.
Alternative scenario:if the price breaks through and consolidates above the resistance level of 3328, the uptrend will likely resume.

News feed for: 2025.05.05
- US ISM Services PMI (m/m) at 17:00 (GMT+3).
This article reflects a personal opinion and should not be interpreted as an investment advice, and/or offer, and/or a persistent request for carrying out financial transactions, and/or a guarantee, and/or a forecast of future events.
