The EUR/USD currency pair
Technical indicators of the currency pair:
- Prev. Open: 1.1237
- Prev. Close: 1.1282
- % chg. over the last day: +0.40 %
According to preliminary estimates, Eurozone hourly wages rose to 3.2% year-on-year in the first quarter of 2025, the smallest increase since the third quarter of 2022. This compares with growth of 3.7% in the previous quarter. The wage component grew to 3.3%, also the slowest pace since Q3 2022, up from 4.1% previously. Lower wages tend to increase the likelihood of lower inflation, which in turn will increase the likelihood of further rate cuts from the ECB.
Trading recommendations
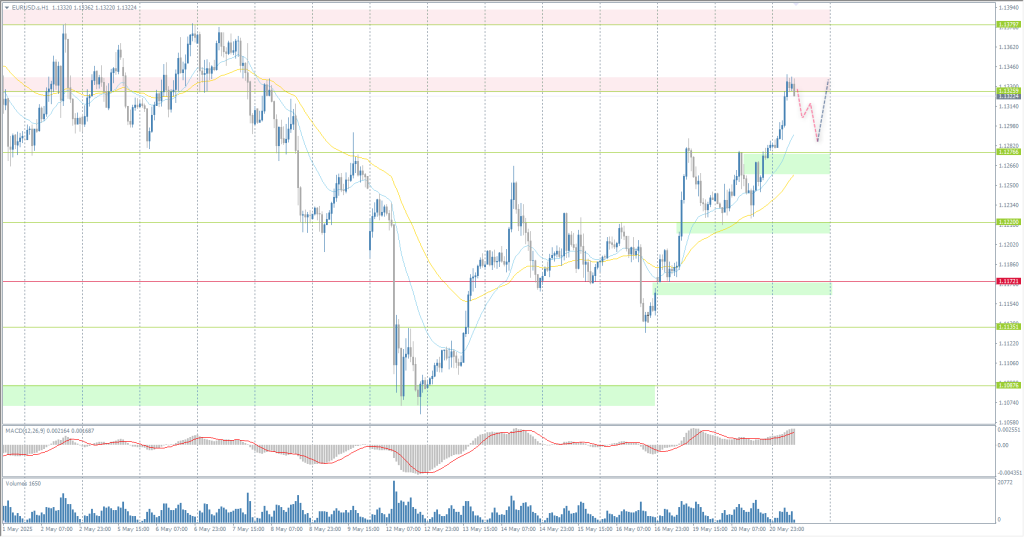
- Support levels: 1.1276, 1.1220, 1.1170, 1.1135, 1.1088, 1.1017, 1.0902
- Resistance levels: 1.1326, 1.1379
The EUR/USD currency pair’s hourly trend has changed to an upward trend. The price has consolidated above the priority change level and above the dynamic EMA lines. Currently, the price has reached the resistance level of 1.1326, where partial fixation of profits is possible, which will lead to a corrective wave to 1.1276. In case the sellers do not react, the price will continue to rise to 1.1379.
Alternative scenario:if the price breaks the support level of 1.1172 and consolidates below it, the downtrend will likely resume.

No news for today
The GBP/USD currency pair
Technical indicators of the currency pair:
- Prev. Open: 1.3358
- Prev. Close: 1.3393
- % chg. over the last day: +0.26 %
The UK’s annual inflation rate jumped to 3.5% in April 2025, the highest since January 2024, up from 2.6% in March and above expectations of 3.3%. CPI rose by 1.2% from the previous month. Meanwhile, annual core inflation accelerated to 3.8% from 3.4%. Bank of England (BoE) policymakers may have a tough decision to make on whether to continue cutting rates. The swap market indicates that two rate cuts are expected from the BoE over the next 12 months.
Trading recommendations
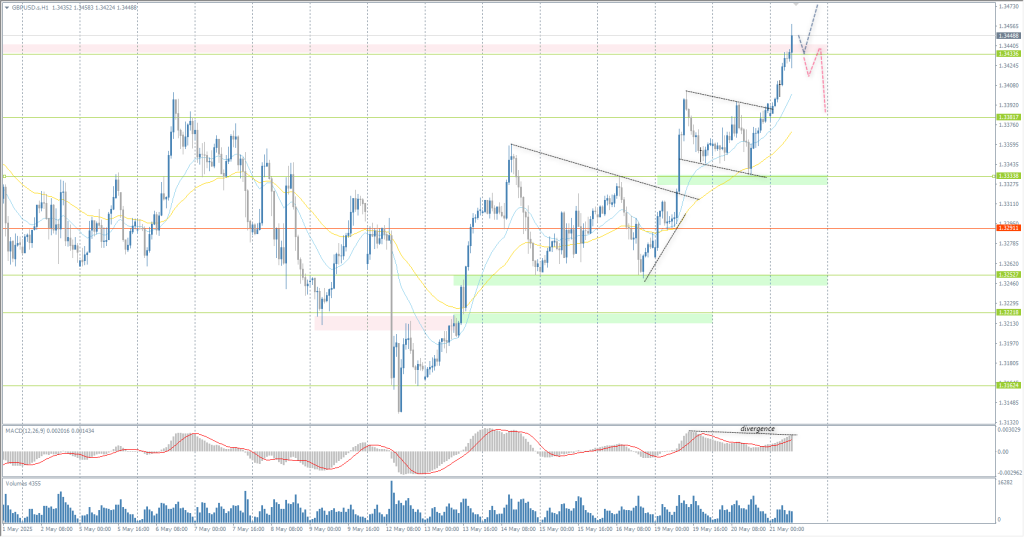
- Support levels: 1.3382, 1.3333, 1.3291, 1.3121
- Resistance levels: 1.3434
In terms of technical analysis, the trend on the currency pair GBP/USD on the hourly time frame has changed to an upward trend. The British pound continues to grow steadily. At the moment, a divergence has formed on the MACD indicator, indicating a possible correction. For buy deals, it is best to consider the EMA lines, or the support level of 1.3382. Selling can be considered from 1.3433, provided sellers react.
Alternative scenario:if the price breaks the support level of 1.3291 and consolidates below it, the downtrend will likely resume.

News feed for: 2025.05.21
- UK Consumer Price Index (m/m) at 09:00 (GMT+3);
- UK Producer Price Index (m/m) at 09:00 (GMT+3).
The USD/JPY currency pair
Technical indicators of the currency pair:
- Prev. Open: 144.83
- Prev. Close: 144.50
- % chg. over the last day: -0.23 %
Tokyo’s trade deficit narrowed sharply in April 2025, although it fell short of market expectations of a surplus. Exports rose for the seventh consecutive month, but at the slowest pace in the current sequence, amid concerns over looming US tariffs. Meanwhile, imports fell for the second month this year, although the drop was smaller than expectations. Japan’s chief trade negotiator Ryosei Akazawa reiterated a call for the removal of US tariffs ahead of the third round of trade talks, which begin this week.
Trading recommendations
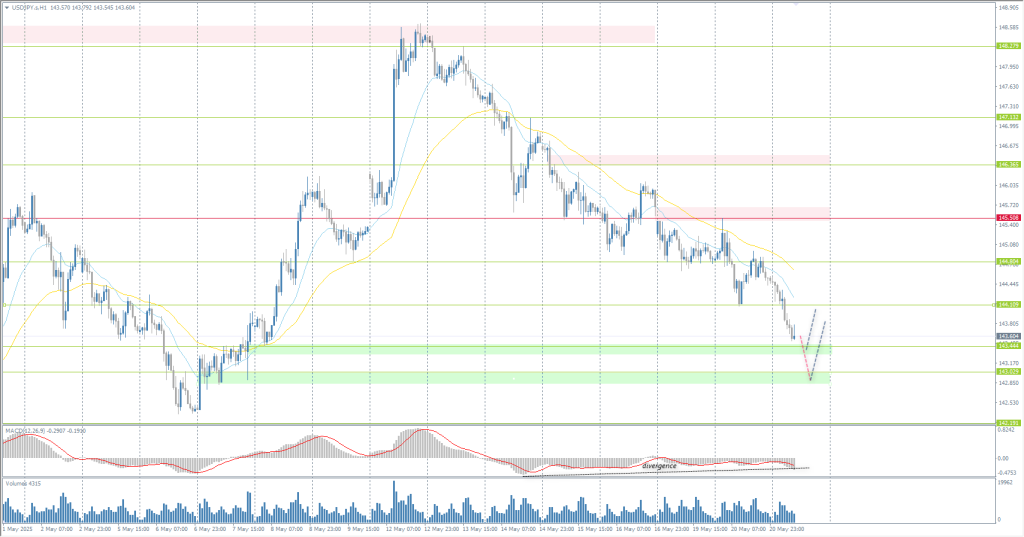
- Support levels: 143.44, 143.01
- Resistance levels: 144.10, 144.80, 145.46, 146.36, 148.28, 150.47
From a technical point of view, the medium-term trend of the USD/JPY is bearish. Currently, the price is aiming at the demand zone below the support level of 143.44. For sell deals, we can consider the EMA lines or the resistance level of 144.11, but with confirmation. The MACD divergence indicates weakness, so there is a high probability of a corrective bounce from the 143.44 or 143.01 support levels.
Alternative scenario:if the price breaks through the resistance level of 147.12 and consolidates above it, the uptrend will likely resume.

News feed for: 2025.05.21
- Japan Trade Balance (m/q) at 02:50 (GMT+3).
The XAU/USD currency pair (gold)
Technical indicators of the currency pair:
- Prev. Open: 3239
- Prev. Close: 3290
- % chg. over the last day: +1.57 %
Gold rose to $3,300 on Wednesday, reaching a two-week high and gaining more than 2% from the previous session, helped by geopolitical risks and sustained weakness in the US dollar. Reports that Israel is planning to strike Iranian nuclear facilities raised fears that the Middle East conflict could escalate as such an attack could provoke retaliation from Iran. In addition to geopolitical concerns, President Trump has said that Russia and Ukraine should immediately begin ceasefire talks, but seems to have signaled that he will back away from mediation. Investor confidence was further shaken by continued uncertainty over tariff policy and the upcoming crucial vote on Trump’s major tax reforms.
Trading recommendations
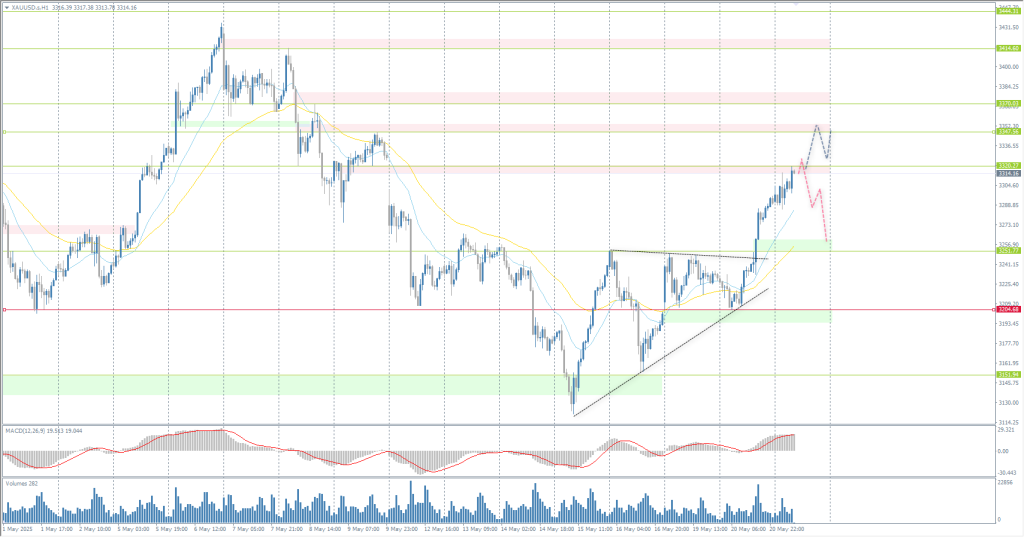
- Support levels: 3251, 3204, 3151, 3103, 3049
- Resistance levels: 3320, 3347, 3370
From the point of view of technical analysis, the trend on the XAU/USD has changed to an uptrend again. The price has consolidated above the dynamic EMA lines and above the priority change level. However, at the moment, the price has deviated strongly from the mid-lines and reached the resistance level of 3320, which increases the probability of a corrective wave. If sellers react here, intraday selling up to 3251 can be considered. A breakout of 3320 will open the way to the 3347 level.
Alternative scenario:if the price breaks and consolidates below the support level of 3204, the downtrend will likely resume.

No news for today
This article reflects a personal opinion and should not be interpreted as an investment advice, and/or offer, and/or a persistent request for carrying out financial transactions, and/or a guarantee, and/or a forecast of future events.
