The EUR/USD currency pair
Technical indicators of the currency pair:
- Prev. Open: 1.1491
- Prev. Close: 1.1521
- % chg. over the last day: -0.26 %
The euro rose on Friday thanks to the weakness of the dollar. However, the euro’s growth was limited after the Eurozone Consumer Confidence Index unexpectedly declined in June, and producer prices in Germany for May showed the largest decline in eight months, which became a “dovish” factor for ECB policy. Swaps are discounting the chances of a 25 bps ECB rate cut at the July 24 meeting at 7%.
Trading recommendations
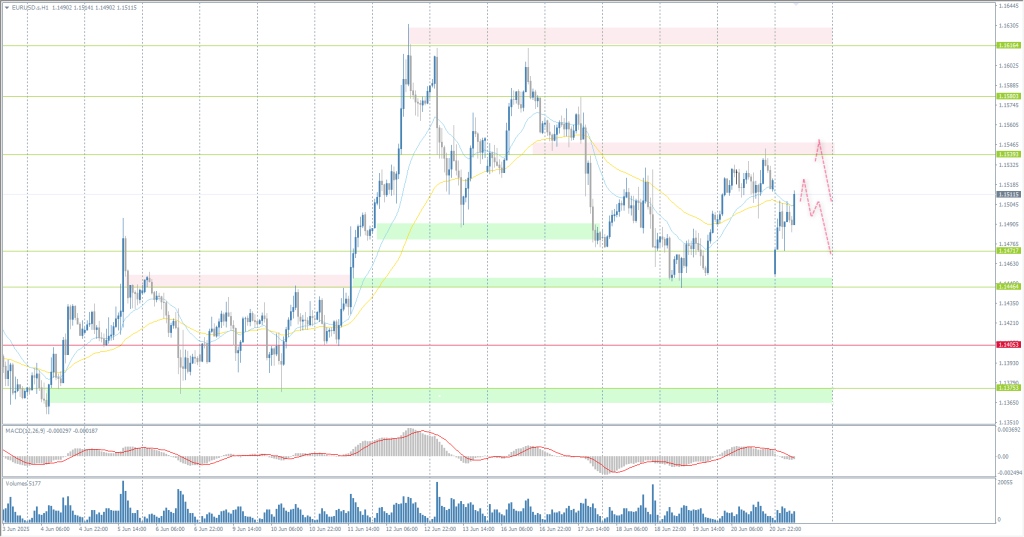
- Support levels: 1.1471, 1.1445, 1.1373, 1.1356, 1.1312, 1.1296, 1.1269
- Resistance levels: 1.1539, 1.1572, 1.1616
The EUR/USD currency pair’s hourly trend is bullish. On Monday, the euro opened with a downward price gap amid the strengthening of the US dollar in response to the US entering the war against Iran this weekend. However, buyers sharply bought up the euro from the support level of 1.1446. Currently, the price is trying to test liquidity above 1.1539. Here, you can consider selling trades, provided that sellers react.
Alternative scenario:if the price breaks through the support level of 1.1405 and consolidates below it, the downward trend will likely resume.

News feed for: 2025.06.23
- German Manufacturing PMI (m/m) at 10:30 (GMT+3);
- German Services PMI (m/m) at 10:30 (GMT+3);
- Eurozone Manufacturing PMI (m/m) at 11:00 (GMT+3);
- Eurozone Services PMI (m/m) at 11:00 (GMT+3);
- US Manufacturing PMI (m/m) at 16:45 (GMT+3);
- US Services PMI (m/m) at 16:45 (GMT+3);
- US Existing Home Sales (m/m) at 17:00 (GMT+3).
The GBP/USD currency pair
Technical indicators of the currency pair:
- Prev. Open: 1.3452
- Prev. Close: 1.3448
- % chg. over the last day: -0.03 %
Economists believe that the British pound will lose ground against the dollar in the second half of the year. The 6-month projection for GBP/USD is 1.33. As for the UK economy, economists predict a significant risk of deterioration for the remainder of 2025. Further tax increases are expected in the fall, which will further undermine confidence and increase the potential for a significant reduction in interest rates by the Bank of England. In this regard, the pound will face difficulties.
Trading recommendations
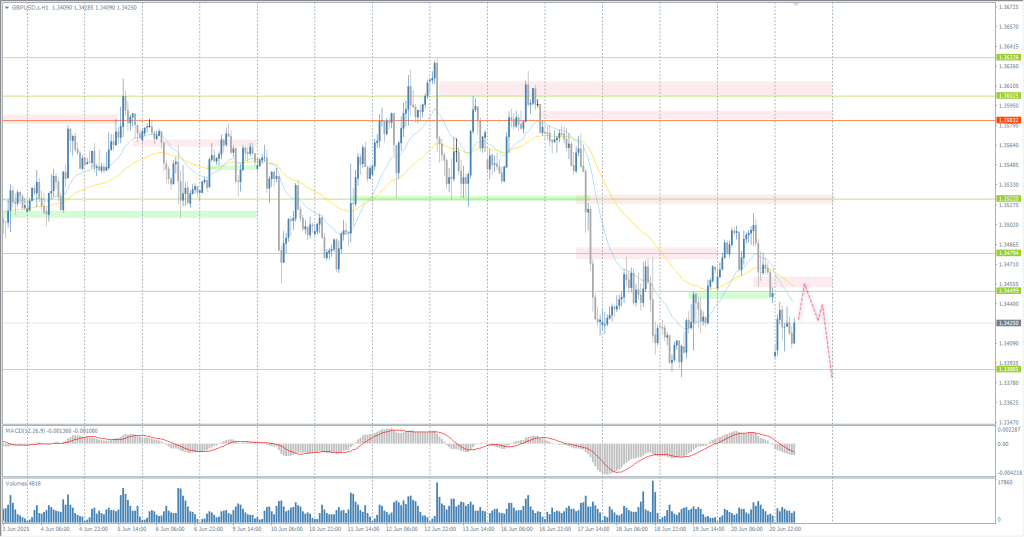
- Support levels: 1.3388, 1.3333, 1.3291, 1.3121
- Resistance levels: 1.3450, 1.3480, 1.3522, 1.3583
In terms of technical analysis, the trend on the currency pair GBP/USD is bearish. The British pound is trading below the EMA lines. There are no prerequisites for a reversal at the moment. Intraday, you can look for sell trades from the EMA lines or from the resistance level of 1.3450, but with confirmation. The profit target is to update the low of the previous week. There are no optimal entry points for buying at the moment.
Alternative scenario:if the price breaks through the resistance level of 1.3583 and consolidates above it, the uptrend will likely resume.

News feed for: 2025.06.23
- UK Manufacturing PMI (m/m) at 11:30 (GMT+3);
- UK Services PMI (m/m) at 11:30 (GMT+3).
The USD/JPY currency pair
Technical indicators of the currency pair:
- Prev. Open: 145.42
- Prev. Close: 146.10
- % chg. over the last day: +0.47 %
On Monday, the Japanese yen fell to 146 per dollar, reaching its lowest level in more than five weeks, as the US dollar became a safer currency following a sharp escalation of tensions in the Middle East. This came after the US launched airstrikes on three Iranian nuclear sites over the weekend, joining Israel in its ongoing conflict with Tehran and raising fears of retaliation. On the domestic front, economic data showed that Japan’s manufacturing sector returned to growth in June for the first time since May 2024, while activity in the service sector increased for the third consecutive month, signaling the resilience of the economy as a whole.
Trading recommendations
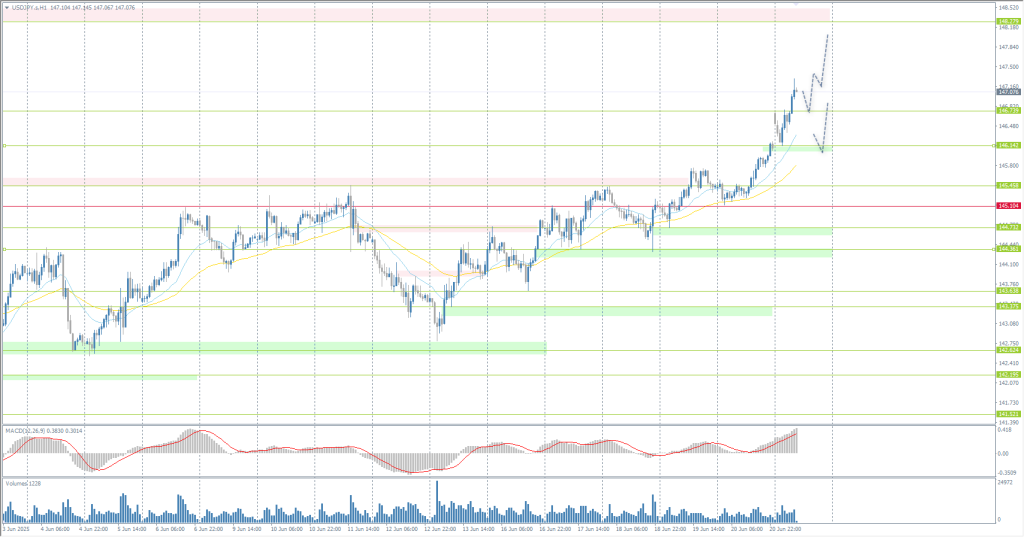
- Support levels: 146.74, 146.14, 145.46, 145.10, 144.73
- Resistance levels: 148.28
From a technical point of view, the medium-term trend of the USD/JPY is bullish. The Japanese yen has consolidated above 146.74, and now the price is on track to reach 148 and above. For buy deals, it is best to use the EMA lines or support levels of 146.74 and 146.14. There are currently no optimal entry points for sales.
Alternative scenario:if the price breaks through the support level of 145.10 and consolidates below it, the downtrend will likely resume.

News feed for: 2025.06.23
- Japan Manufacturing PMI (m/m) at 03:30 (GMT+3);
- Japan Services PMI (m/m) at 03:30 (GMT+3).
The XAU/USD currency pair (gold)
Technical indicators of the currency pair:
- Prev. Open: 3369
- Prev. Close: 3369
- % chg. over the last day: 0.0 %
Gold fell to $3,350 per ounce on Monday as traders favored the US dollar amid escalating tensions in the Middle East. The US got involved in Israel’s war against Iran, striking three of Iran’s main nuclear facilities over the weekend, and President Donald Trump warned of further strikes if Tehran does not make peace. Investors are now closely watching Iran’s response. Any aggressive response could trigger a rebound in gold as a safe-haven asset.
Trading recommendations
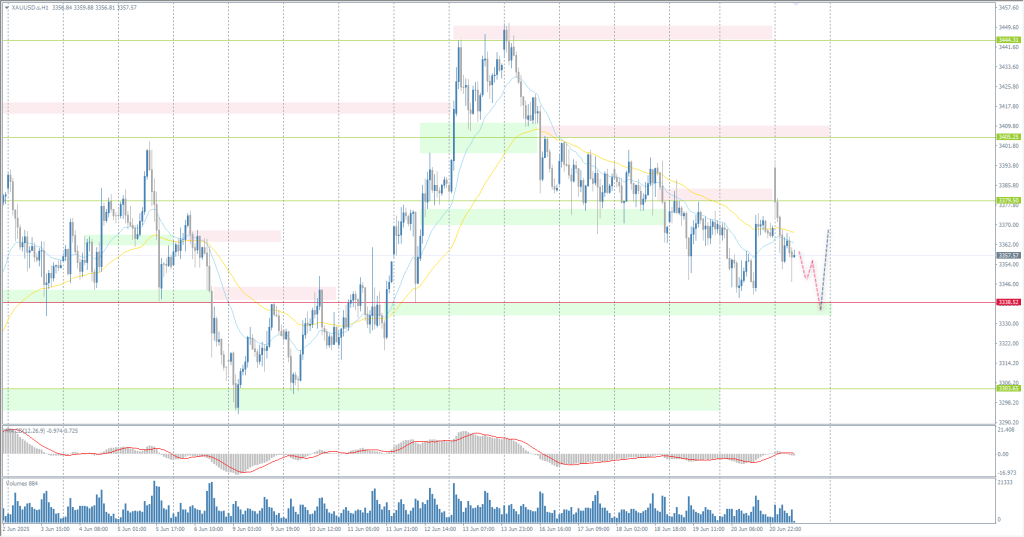
- Support levels: 3338, 3315, 3303, 3272, 3248
- Resistance levels: 3379, 3405, 3444, 3500
From the point of view of technical analysis, the trend on the XAU/USD is bullish, but close to a reversal. The situation for gold has not changed significantly since last week. Gold is heading towards the priority change level of 3338. Below this level, there is a concentration of liquidity, and it is important to assess the price action on this liquidity. If, after testing, the price impulsively returns above the level, this will be a strong signal to buy. If, during testing, the price impulsively closes below, this will trigger a sell-off to 3315.
Alternative scenario:if the price breaks and consolidates below the support level of 3338, the downtrend will likely resume.

News feed for: 2025.06.23
- US Manufacturing PMI (m/m) at 16:45 (GMT+3);
- US Services PMI (m/m) at 16:45 (GMT+3);
- US Existing Home Sales (m/m) at 17:00 (GMT+3).
This article reflects a personal opinion and should not be interpreted as an investment advice, and/or offer, and/or a persistent request for carrying out financial transactions, and/or a guarantee, and/or a forecast of future events.
