The EUR/USD currency pair
Technical indicators of the currency pair:
- Prev. Open: 1.1655
- Prev. Close: 1.1666
- % chg. over the last day: +0.09 %
The euro retreated from its weekly high on Thursday and fell on weaker-than-expected news about industrial production in Germany. In addition, the strengthening of the dollar on Thursday put pressure on the euro. The euro is also struggling due to concerns that President Trump’s tariff policy will limit economic growth in the Eurozone. Swaps estimate the probability of an ECB rate cut of 25 bps at the September 11 meeting at 12%.
Trading recommendations
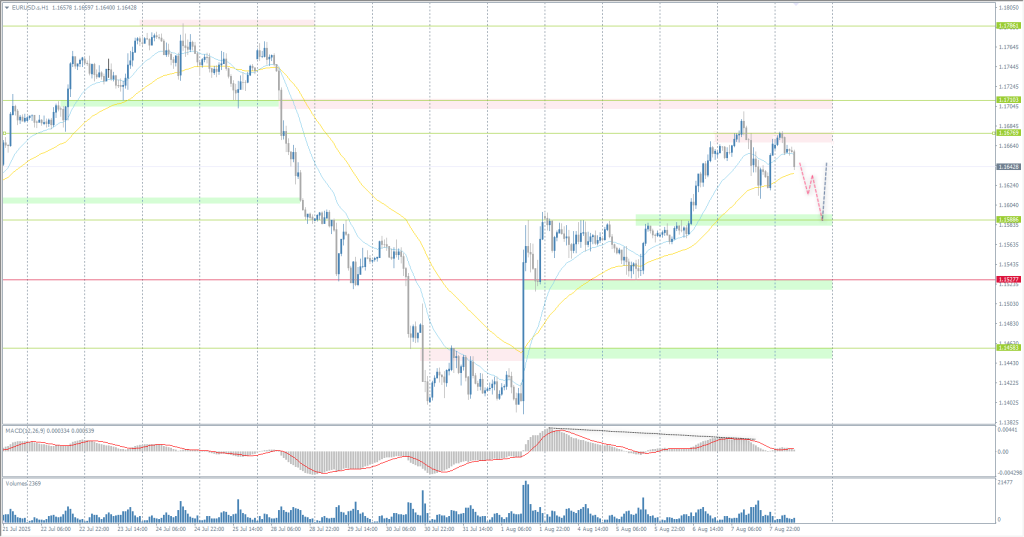
- Support levels: 1.1589, 1.1528, 1.1485, 1.1375, 1.1313
- Resistance levels: 1.1678, 1.1710, 1.1770
The EUR/USD currency pair’s hourly trend is bullish. Buyers began to fix previously opened positions, which led to the resistance level of 1.1578 becoming a stumbling block for further growth. For buy deals, traders can consider the EMA lines, but with confirmation, as there is a high probability of a correction to 1.1589.
Alternative scenario:if the price breaks the support level of 1.1528 and consolidates below it, the downtrend will likely resume.

No news for today
The GBP/USD currency pair
Technical indicators of the currency pair:
- Prev. Open: 1.3352
- Prev. Close: 1.3443
- % chg. over the last day: +0.68 %
The British pound strengthened to $1.34, its highest level in two weeks, as traders reacted to the Bank of England’s latest monetary policy decision. The Central Bank, as expected, cut the rate by 25 basis points, bringing the key bank rate down to 4%, its lowest level since 2023. However, the decision revealed deep divisions, with the rate cut approved by a narrow 5–4 majority after an initial vote that split opinions into three parts. For the first time, a second round of voting was required to reach a final decision. Governor Bailey added that “interest rates are still on a downward path, but any future cuts should be gradual and cautious.” The bank also raised its inflation expectations for September to 4% from 3.7%. In response, traders lowered their expectations for further rate cuts this year. Markets now estimate an additional rate cut of only 17 basis points in 2025, whereas before the announcement, another 25-basis-point cut was expected.
Trading recommendations
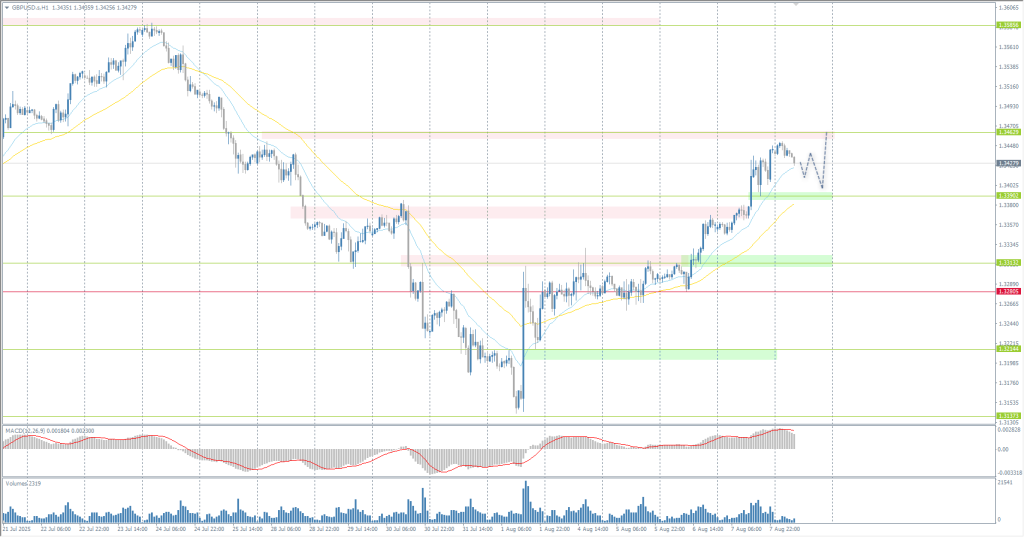
- Support levels: 1.3390, 1.3313, 1.3214, 1.3137
- Resistance levels: 1.3462, 1.3586
In terms of technical analysis, the trend on the currency pair GBP/USD has changed to upward. The price has consolidated above the priority change level and is trading above the EMA lines. Currently, the price is seeking to test liquidity above 1.3463. For buy deals, it is best to consider the EMA lines or the support level of 1.3390, but with confirmation. There are currently no optimal entry points for sales.
Alternative scenario:if the price breaks through the support level of 1.3280 and consolidates below it, the downward trend will likely resume.

No news for today
The USD/JPY currency pair
Technical indicators of the currency pair:
- Prev. Open: 147.31
- Prev. Close: 147.12
- % chg. over the last day: -0.13 %
According to the summary of the July meeting, the Bank of Japan is increasingly leaning toward raising interest rates, and one politician believes that the increase could happen as early as the end of the year. Several board members cited growing inflation risks, warning that the bank should not “miss the opportunity” to raise rates and should act “on time” to avoid more drastic moves in the future. There remains some uncertainty regarding US trade policy, although one committee member welcomed Japan’s deal with the US as “great progress.” Inflation expectations are approaching 2%, but there are concerns that they could rise even further. This caution reflects the Central Bank’s latest report, which warned of persistent inflation caused by food prices.
Trading recommendations
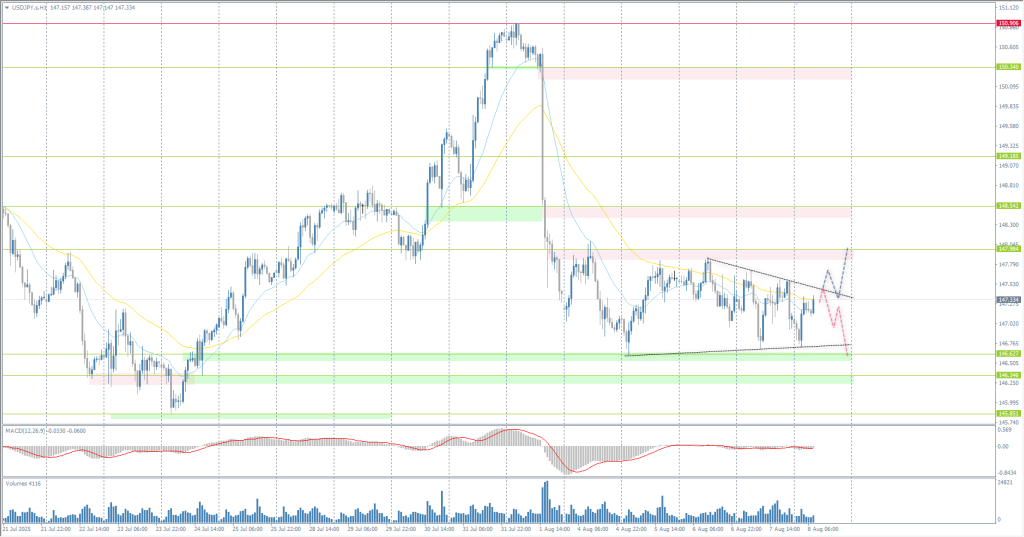
- Support levels: 146.62, 146.34
- Resistance levels: 147.98, 148.54, 149.18, 150.34
From a technical point of view, the medium-term trend of the USD/JPY is bearish. The Japanese yen is forming a flat accumulation with boundaries of 146.62–147.98. At the same time, there is a narrowing of liquidity in the form of a triangle within the flat. If the price manages to consolidate above the downward line of the triangle, this will open up opportunities for buy deals up to 147.98. If sellers react to the upper boundary of the triangle, sales up to 146.62 can be considered.
Alternative scenario:if the price breaks through the support level of 150.91 and consolidates below it, the downtrend will likely resume.

No news for today
The XAU/USD currency pair (gold)
Technical indicators of the currency pair:
- Prev. Open: 3371
- Prev. Close: 3396
- % chg. over the last day: +0.74 %
On Friday, gold fell to around $3380 per ounce, retreating from a two-week high as investors took profits. Nevertheless, the metal is showing its second consecutive weekly gain, supported by trade tensions and expectations of a more dovish US monetary policy. President Trump’s sweeping tariffs of 10% to 50% targeting dozens of countries have come into effect, as well as a separate announcement of 100% tariffs on semiconductor imports. Meanwhile, Minneapolis Fed President Kashkari has spoken out in favor of lowering rates amid signs of an economic slowdown, as the number of jobless claims exceeded expectations and the number of continuing claims reached a three-year high. The US has imposed tariffs on 1 kg and 100 oz gold bars to reduce its dependence on imports, especially from Switzerland, which could lead to a reduction in domestic supply and higher prices. Elsewhere, China increased its gold purchases for the ninth consecutive month in July.
Trading recommendations
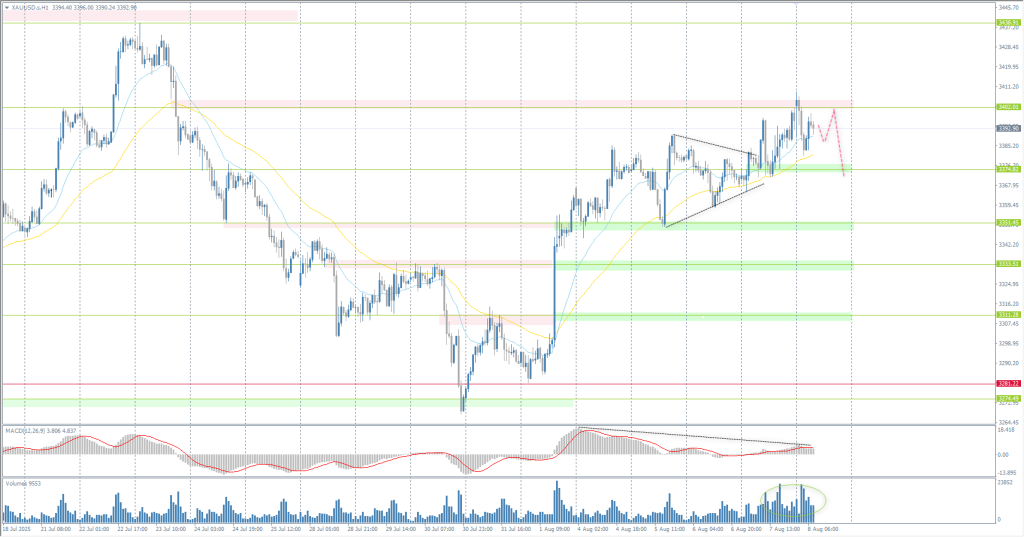
- Support levels: 3374, 3351, 3333, 3311, 3281
- Resistance levels: 3402, 3433
From the point of view of technical analysis, the trend on the XAU/USD is bullish. Gold reached the resistance level of 3402, where previously opened purchases began to be fixed. Given the growth in volume and MACD divergence, there is a high probability of a corrective movement to 3374. Intraday, sales to this level can be considered, but with a short stop loss. There are currently no optimal entry points for buy deals.
Alternative scenario:if the price breaks the support level of 3281 and consolidates below it, the downtrend will likely resume.

No news for today
This article reflects a personal opinion and should not be interpreted as an investment advice, and/or offer, and/or a persistent request for carrying out financial transactions, and/or a guarantee, and/or a forecast of future events.
