The EUR/USD currency pair
Technical indicators of the currency pair:
- Prev. Open: 1.1591
- Prev. Close: 1.1632
- % chg. over the last day: +0.35 %
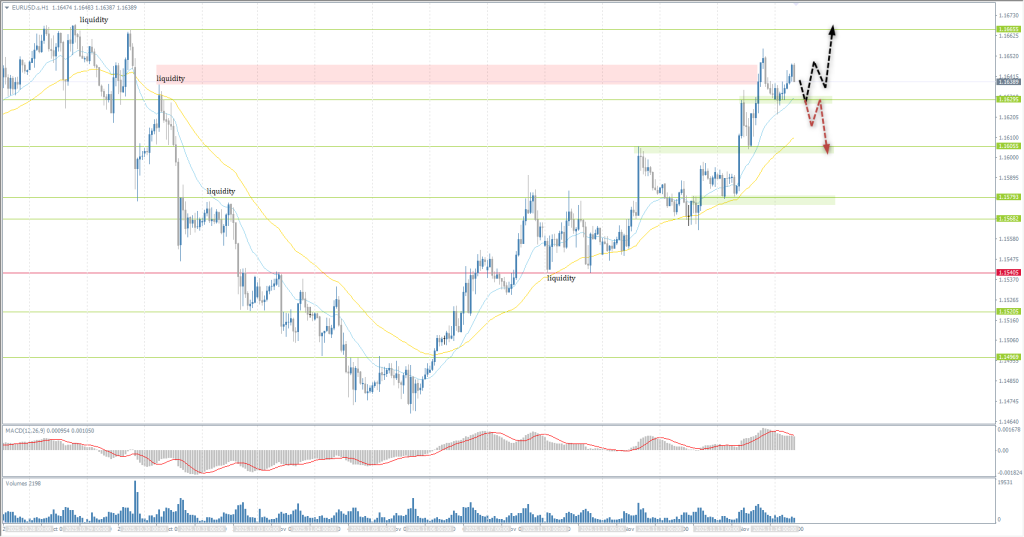
The euro rose above $1.16, approaching its highest levels since late October. The currency was supported by increased risk appetite following the reopening of the US federal government and expectations of new monetary policy signals from the ECB and the Fed. On Wednesday evening, US President Donald Trump signed the bill ending the 43-day shutdown, allowing the release of accumulated economic data. However, Washington authorities warned that employment and inflation figures for October may not be published.
Trading recommendations
- Support levels: 1.1630, 1.1605, 1.1579, 1.1568, 1.1540
- Resistance levels: 1.1665
The hourly trend for EUR/USD has shifted upward. The price continues to rise steadily, with each rebalancing leading to impulsive upward moves. Intraday, buying opportunities can be sought from support at 1.1630, but with confirmation, as MACD divergence points to a possible technical correction. If the price consolidates below 1.1630, expect a correction to 1.1606.
Alternative scenario:if the price breaks support at 1.1540 and consolidates below, the downtrend will likely resume.

News feed for: 2025.11.14
- Eurozone GDP (q/q) at 12:00 (GMT+2);
- Eurozone Trade Balance (m/m) at 12:00 (GMT+2).
The GBP/USD currency pair
Technical indicators of the currency pair:
- Prev. Open: 1.3128
- Prev. Close: 1.3188
- % chg. over the last day: +0.45 %
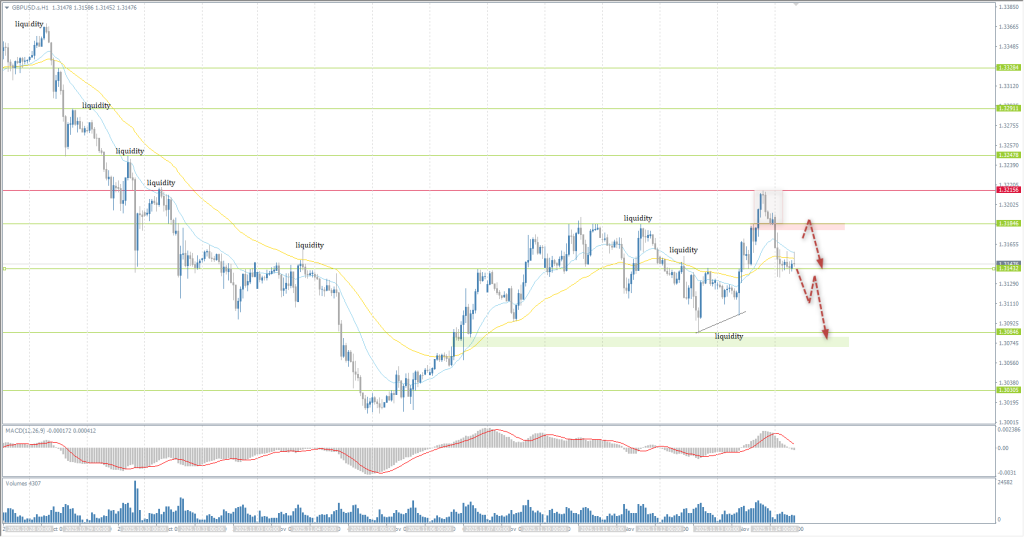
The British pound weakened to around $1.31, near a seven-month low, after reports that the government abandoned plans to raise income tax rates ahead of the November 26 budget release. The abrupt policy shift heightened investor concerns about fiscal discipline and political stability, reducing demand for pound-denominated assets and adding pressure on UK bonds.
Trading recommendations
- Support levels: 1.3143, 1.3085, 1.3072
- Resistance levels: 1.3185, 1.3216, 1.3247, 1.3291, 1.3328, 1.3365
Technically, the trend on the GBP/USD currency pair is bearish. The pound trades weaker than the euro. Yesterday, the price attempted to consolidate above the priority-shift level, but sellers defended their positions. Moreover, a localized balance formed above 1.3185, acting as resistance. Liquidity “locked” above that level will likely be redistributed below support at 1.3085. Therefore, a break of 1.3143 could trigger a wave of selling. No optimal entry points for buying at the moment.
Alternative scenario:if the price breaks through the resistance level of 1.3216 and consolidates above it, the uptrend will likely resume.

No news for today
The USD/JPY currency pair
Technical indicators of the currency pair:
- Prev. Open: 154.74
- Prev. Close: 154.53
- % chg. over the last day: -0.13 %
Bank of Japan Governor Ueda, speaking in parliament, emphasized that the regulator remains focused on achieving moderate, sustainable inflation supported by wage growth and stable economic recovery – a stance largely aligned with new Prime Minister Takaichi. Markets currently estimate the probability of a 25 bps rate hike at about 25% in December and around 50% in January. Meanwhile, Finance Minister Satsuki Katayama again warned of risks from excessive yen weakness, as the currency approached 155, calling sharp one-sided moves undesirable.
Trading recommendations
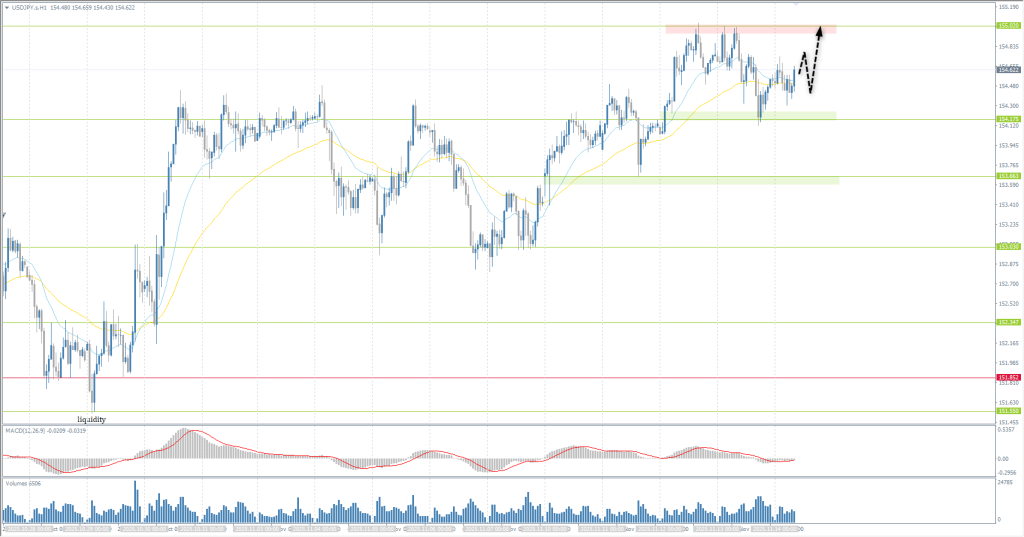
- Support levels: 154.17, 153.58, 153.15, 151.51, 150.87, 150.15
- Resistance levels: 155.02, 156.54
The medium-term trend is bullish. A flat accumulation is forming with boundaries at 154.17-155.02. Intraday bias favors buyers, but the price is in the middle of the balance, complicating entry timing. Buying opportunities are best sought from the lower boundary, and selling from the upper boundary, but confirmation is required in both cases.
Alternative scenario:if the price breaks below 151.85 and consolidates lower, a bearish trend will likely resume.

No news for today
The XAU/USD currency pair (gold)
Technical indicators of the currency pair:
- Prev. Open: 4196
- Prev. Close: 4164
- % chg. over the last day: -0.77%
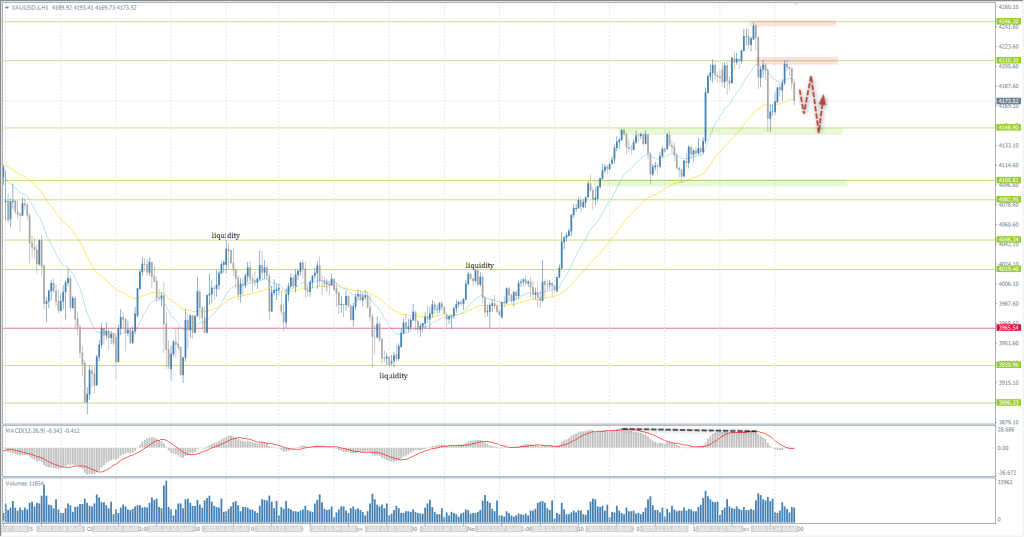
On Thursday, gold prices fell to $4,160 per ounce, retreating from a three-week high after broad selling following the reopening of the US government. The initial rise was linked to expectations that delayed official macro data would show labor market weakness and strengthen arguments for imminent Fed easing. However, those hopes faded as Treasury yields rose, increasing the opportunity cost of holding non-yielding gold. Despite the pullback, gold is still up about 5% for the week, with the decline looking like a mix of profit-taking and correction.
Trading recommendations
- Support levels: 4148, 4100, 4083, 4046, 4019, 3965
- Resistance levels: 4210, 4246, 4379
Technically, the medium-term is bullish. Yesterday, gold corrected to support at 4148, where buyers showed initiative. Sellers, in turn, formed resistance at 4210. Intraday bias favors bears, with a high probability of retesting 4148 and setting a new low. Buying opportunities are best sought from 4148, but with confirmation of a bullish reaction. A break and consolidation below 4148 will open the path to 4100.
Alternative scenario:if the price breaks support at 3965 and consolidates below, the downtrend will likely resume.

No news for today
This article reflects a personal opinion and should not be interpreted as an investment advice, and/or offer, and/or a persistent request for carrying out financial transactions, and/or a guarantee, and/or a forecast of future events.
