The EUR/USD currency pair
Indicateurs techniques de la paire de devises:
- Précédent Ouvrir: 1.1197
- Précédent Fermer: 1.1085
- % vari. au cours du dernier jour: -1.01 %
The euro slid to USD 1.1080, hitting its lowest level since April 9, as easing trade tensions between Washington and Beijing contributed to the strength of the US dollar. The US and China agreed to cut tariffs for 90 days after talks in Geneva, a significant de-escalation of the trade war that erupted last month. Under the deal, US tariffs on Chinese goods will drop from 145% to 30%, while China’s duties on US imports will drop from 125% to 10%. The deal has attracted fresh capital into dollar assets, boosting the US dollar and putting pressure on the euro.
Recommandations de trading
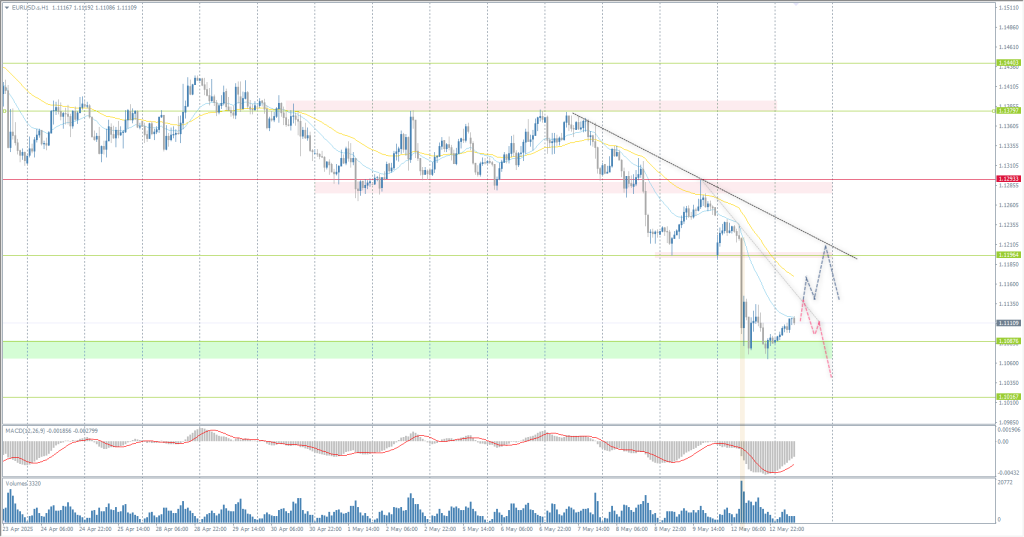
- Niveaux de support: 1.1088, 1.1017, 1.0902
- Niveaux de résistance: 1.1196, 1.1293, 1.1379
The EUR/USD currency pair’s hourly trend is bearish. The euro has reached the support level of 1.1088, but the reaction of buyers here is weak. Volumes and price action indicate a strong bearish bias. Under these market conditions, sell trades should be considered from the downtrend line. A breakout of this line could trigger a sharp rise in price to 1.1196, where selling could also be considered, provided sellers take the initiative.
Scénario alternatif:if the price breaks the resistance level of 1.1293 and consolidates above it, the uptrend will likely resume.

Fil d'actualité pour: 2025.05.13
- German ZEW Economic Sentiment (m/m) at 12:00 (GMT+3);
- Eurozone ZEW Economic Sentiment (m/m) at 12:00 (GMT+3);
- US Consumer Price Index (m/m) at 15:30 (GMT+3).
The GBP/USD currency pair
Indicateurs techniques de la paire de devises:
- Précédent Ouvrir: 1.3262
- Précédent Fermer: 1.3176
- % vari. au cours du dernier jour: -0.65 %
The British pound weakened to $1.3, the lowest level since April 11, as the dollar strengthened on news that the US and China agreed on a sharp reduction in tariffs. Further boosting trade optimism was the fact that US President Trump and UK Prime Minister Starmer last week reached a long-awaited agreement to remove non-tariff barriers in the UK, speeding the passage of US goods through customs and protecting the UK auto and steel sectors. The UK has also reached a trade agreement with India and is preparing for negotiations with the EU.
Recommandations de trading
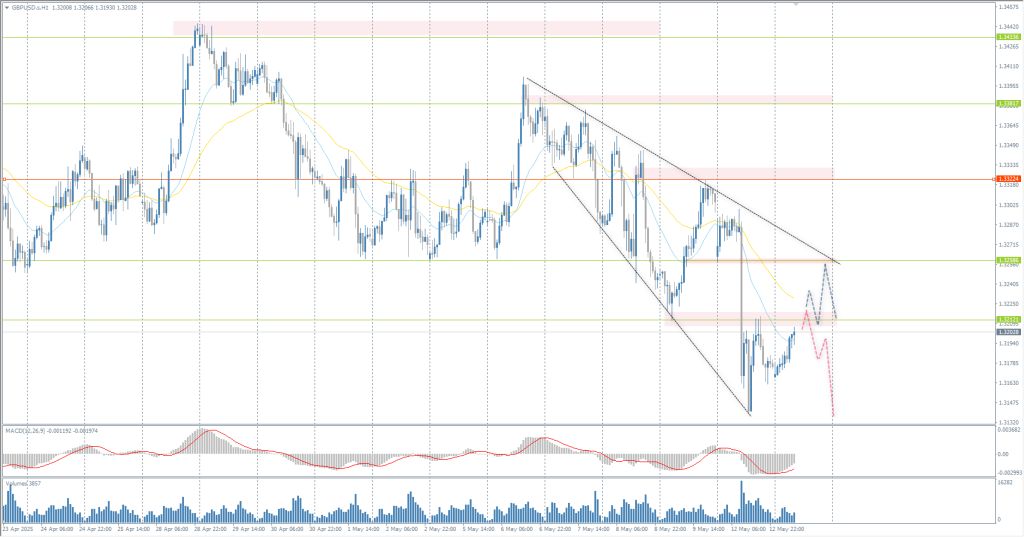
- Niveaux de support: 1.3121, 1.3031
- Niveaux de résistance: 1.3212, 1.3258, 1.3322
In terms of technical analysis, the trend on the currency pair GBP/USD on the hourly time frame is bearish. The British pound, like the euro, fell sharply in price against the US dollar yesterday. The bias remains with the bears. For selling, we can consider the resistance level of 1.3212 or 1.3258. The profit target is 1.3121. There are no optimal entry points for buying right now.
Scénario alternatif:if the price breaks the resistance level of 1.3322 and consolidates above it, the uptrend will likely resume.

Fil d'actualité pour: 2025.05.13
- UK Average Earnings Index (m/m) at 09:00 (GMT+3);
- UK Claimant Count Change (m/m) at 09:00 (GMT+3);
- UK Unemployment Rate (m/m) at 09:00 (GMT+3);
- UK Trade Balance (m/m) at 09:00 (GMT+3);
- UK BOE Gov Bailey Speaks (m/m) at 18:00 (GMT+3).
The USD/JPY currency pair
Indicateurs techniques de la paire de devises:
- Précédent Ouvrir: 146.22
- Précédent Fermer: 148.46
- % vari. au cours du dernier jour: +1.53 %
The Japanese yen held near 148 per dollar on Tuesday, having lost about 2% in the previous session, driven by a stronger dollar as the initial trade agreement between the US and China boosted investor confidence in the dollar. Meanwhile, Japanese Prime Minister Shigeru Ishiba said Japan will not agree to any initial trade deal with the US that excludes provisions on automobiles and called on Washington to waive 25% tariffs on Japanese cars. Meanwhile, the Bank of Japan’s latest Consolidated Opinion Survey showed that policymakers prefer to take a cautious stance amid heightened uncertainty over economic and price developments.
Recommandations de trading
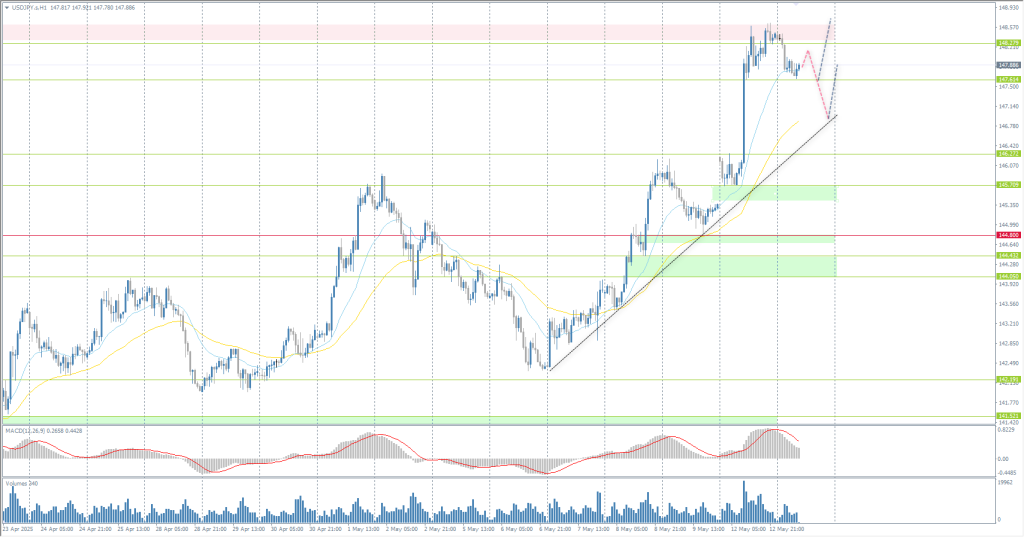
- Niveaux de support: 147.61, 146.27, 145.71, 144.80
- Niveaux de résistance: 148.28, 150.47
From a technical point of view, the medium-term trend of the USD/JPY is bullish. The Japanese yen has reached an important resistance level at 148.28. However, the absence of divergence indicates a high probability of growth continuation. For buying, we can consider the support level of 147.61 or the ascending trend line. There are no optimal entry points for selling now.
Scénario alternatif:if the price breaks the support level of 144.80 and consolidates below it, the downtrend will likely resume.

Aucune nouvelle pour aujourd'hui
The XAU/USD currency pair (gold)
Indicateurs techniques de la paire de devises:
- Précédent Ouvrir: 3288
- Précédent Fermer: 3234
- % vari. au cours du dernier jour: -1.67 %
Gold prices fell nearly 3% to $3,230 per ounce on Monday, hitting their lowest level in about a month, as improving investor sentiment and lower demand for safe-haven assets followed news of major tariff cuts from the US and China. The move represents a significant de-escalation of the trade war and signals a mutual willingness to compromise rather than continue the confrontation. Market optimism was also supported by the ceasefire between India and Pakistan. In Europe, Ukrainian President Zelensky expressed his willingness to meet with Russian President Putin in Turkey on Thursday, which is a negative factor for such a risk-hedging asset as gold.
Recommandations de trading
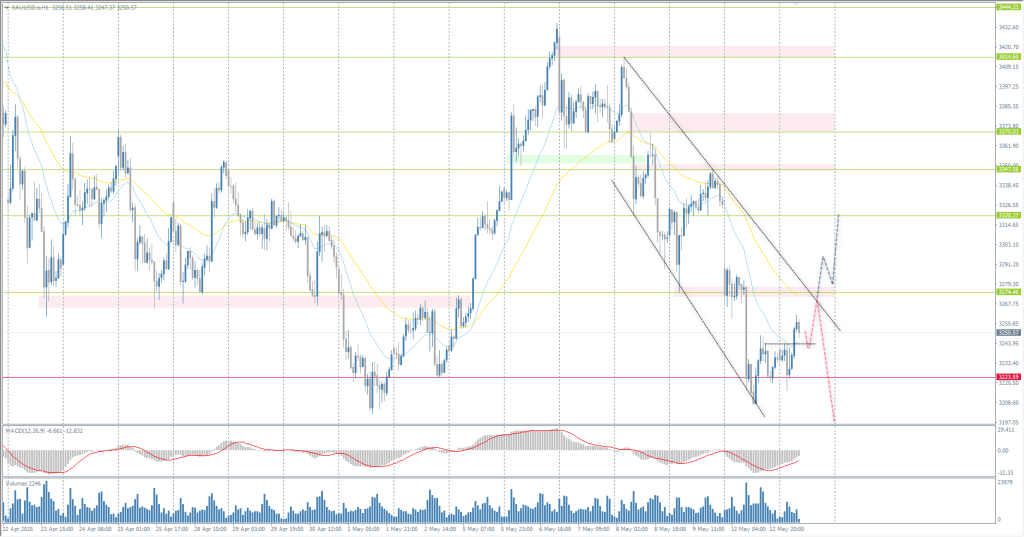
- Niveaux de support: 3223, 3194
- Niveaux de résistance: 3274, 3320, 3347, 3370
From the point of view of technical analysis, the trend on the XAU/USD is bullish. Gold reached the 3224 priority shift level on Monday, where buyers reacted. However, intra-day bias remains with the sellers. For selling, we can consider the 3274 resistance level or the downtrend line. A breakout and consolidation above 3274 could trigger a rise to 3220.
Scénario alternatif:if the price breaks and consolidates below the support level of 3223, the downtrend will likely resume.

Fil d'actualité pour: 2025.05.13
- US Consumer Price Index (m/m) at 15:30 (GMT+3)..
Cet article reflète une opinion personnelle et ne doit pas être interprété comme un conseil en investissement, et/ou une offre, et/ou une demande persistante de réalisation d'opérations financières, et/ou une garantie, et/ou une prévision d'événements futurs.
