The EUR/USD currency pair
Indicateurs techniques de la paire de devises:
- Précédent Ouvrir: 1.1698
- Précédent Fermer: 1.1717
- % vari. au cours du dernier jour: +0.16 %
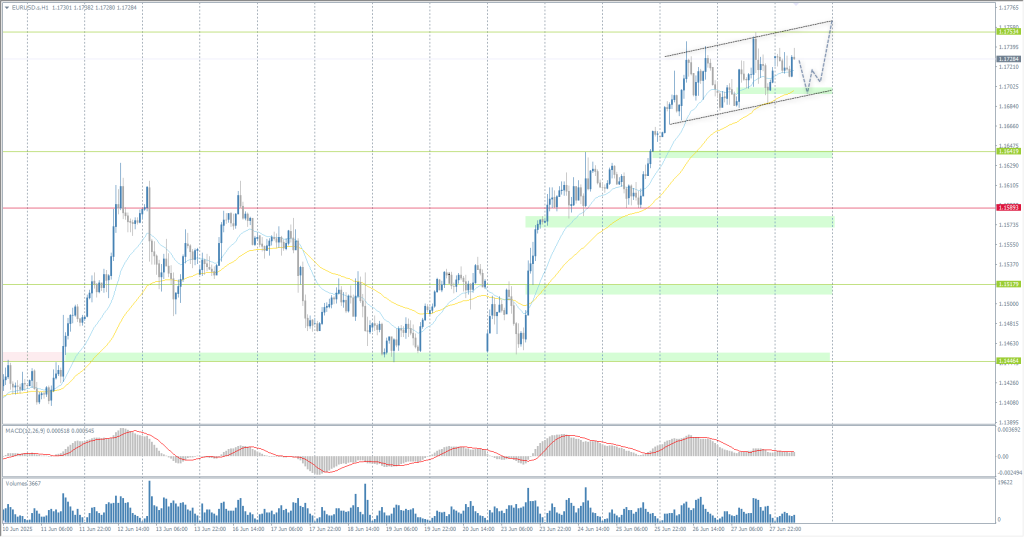
The EUR/USD pair reached a new three-year high on Friday. The euro rose on Friday amid a stronger-than-expected French Consumer Price Index (CPI) report for June, which is hawkish for ECB policy. In addition, rising German bond yields widened the euro interest rate differential after 10-year German bond yields rose to a one-week high on Friday at 2.606%. Swaps estimate the probability of the ECB cutting rates by 25 bps at its July 24 meeting at just 7%.
Recommandations de trading
- Niveaux de support: 1.1666, 1.1642, 1.1581, 1.1518, 1.1471, 1.1445, 1.1
- Niveaux de résistance: 1.1913
The EUR/USD currency pair’s hourly trend is bullish. The euro has consolidated above 1.1694 and is trading above the EMA lines, which potentially opens the way for the price to reach 1.1913 on the higher time frames. For buy deals in continuation of the trend, it is worth considering the EMA lines or the support level of 1.1642, but with confirmation. There are currently no optimal entry points for sales.
Scénario alternatif:if the price breaks through the support level of 1.1589 and consolidates below it, the downward trend will likely resume.

Fil d'actualité pour: 2025.06.30
- German Retail Sales (m/m) at 09:00 (GMT+3);
- German Inflation Rate (m/m) at 15:00 (GMT+3);
- US Chicago PMI (m/m) at 16:45 (GMT+3);
- Eurozone ECB President Lagarde Speaks at 20:30 (GMT+3).
The GBP/USD currency pair
Indicateurs techniques de la paire de devises:
- Précédent Ouvrir: 1.3727
- Précédent Fermer: 1.3719
- % vari. au cours du dernier jour: -0.06 %
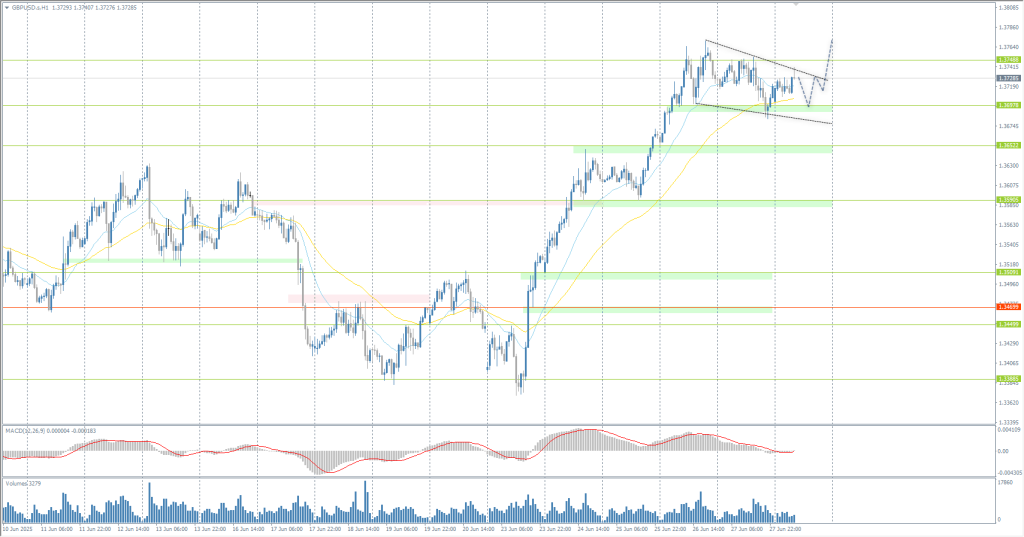
On Monday, the US dollar index hovered around 97.2, remaining at its lowest level since February 2022, as markets faced softer expectations from the Federal Reserve, growing budget problems, and ongoing trade uncertainty. This week, investors are awaiting key US employment data, which could reveal signs of softening in the labor market and strengthen the case for a rate cut as early as July. This could provide additional support for the pound sterling.
Recommandations de trading
- Niveaux de support: 1.3698, 1.3652, 1.3591, 1.3509, 1.3471, 1.3450, 1.3388
- Niveaux de résistance: 1.3748, 1.4000
In terms of technical analysis, the trend on the currency pair GBP/USD is bullish. The situation has not changed significantly since Friday. Currently, there is some profit-taking, which is leading to the formation of a flat. For buy deals in continuation of the trend, it is best to consider the EMA lines or the support level of 1.3698. There are currently no optimal entry points for sales.
Scénario alternatif:if the price breaks through the support level of 1.3470 and consolidates below it, the downward trend will likely resume.

Fil d'actualité pour: 2025.06.30
- UK GDP (q/q) at 09:00 (GMT+3).
The USD/JPY currency pair
Indicateurs techniques de la paire de devises:
- Précédent Ouvrir: 144.37
- Précédent Fermer: 144.64
- % vari. au cours du dernier jour: +0.18 %
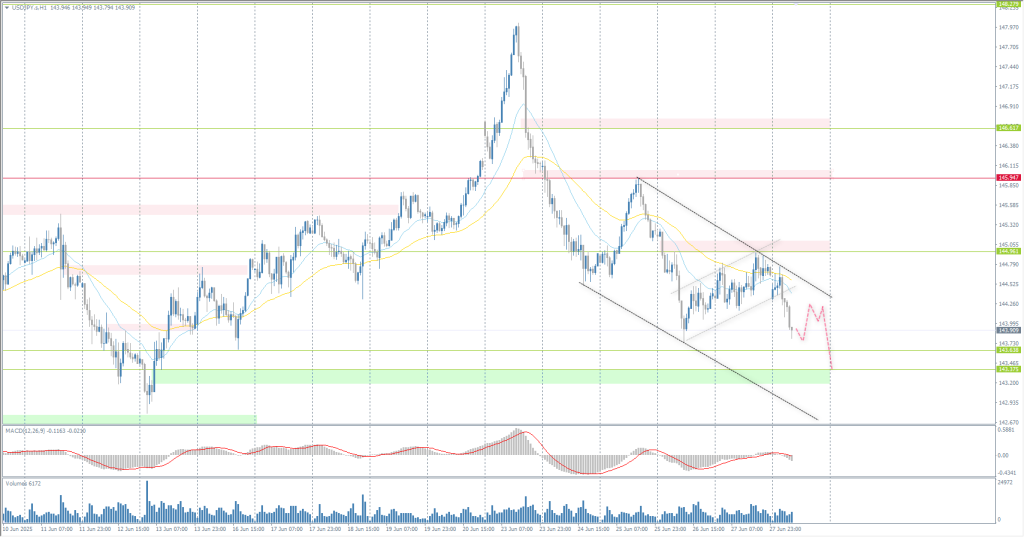
On Monday, the Japanese yen strengthened to 144 per dollar, approaching two-week highs, while the US dollar continued its decline amid softer expectations from the Federal Reserve, growing budget problems, and ongoing trade uncertainty. Markets are awaiting key US employment data this week, which could reveal signs of weakness in the labor market and reinforce expectations of a Fed rate cut in July. Domestically, Japan’s industrial production rose less than expected in May as higher US tariffs continue to weigh on the outlook.
Recommandations de trading
- Niveaux de support: 143.64, 143.37
- Niveaux de résistance: 144.96, 145.95, 146.62, 148.28
From a technical point of view, the medium-term trend of the USD/JPY is bearish. After a slight correction amid profit-taking, the price continued to decline. Currently, the price is trying to test liquidity below 143.47. Sell trades should be considered from the EMA line or the resistance level of 144.96. There are no optimal entry points for buy deals at the moment.
Scénario alternatif:if the price breaks through the resistance level of 145.95 and consolidates above it, the uptrend will likely resume.

Fil d'actualité pour: 2025.06.30
- Japan Industrial Production (m/m) at 02:50 (GMT+3).
The XAU/USD currency pair (gold)
Indicateurs techniques de la paire de devises:
- Précédent Ouvrir: 3327
- Précédent Fermer: 3274
- % vari. au cours du dernier jour: -1.62 %
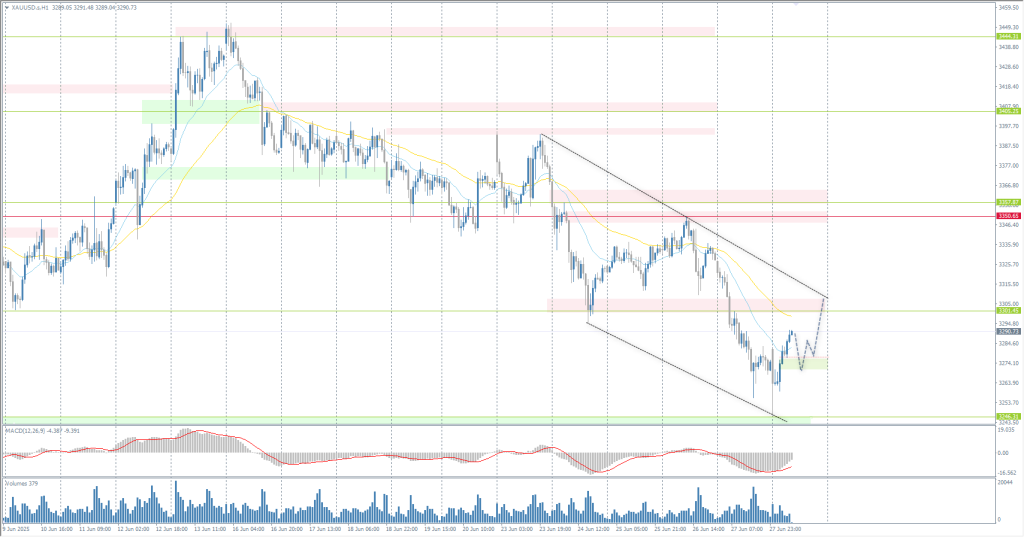
On Friday, gold fell more than 1.5% to below $3270 per ounce, resulting in a weekly decline of 3%, which was the second consecutive weekly loss, as easing geopolitical tensions and improving global trade prospects reduced demand for safe-haven assets. Meanwhile, US data showed that the core PCE Index rose slightly above expectations but remained at a moderate inflation level, reinforcing hopes for a Fed rate cut this year.
Recommandations de trading
- Niveaux de support: 3246
- Niveaux de résistance: 3301, 3350, 3357, 3393, 3405, 3444, 3500
From the point of view of technical analysis, the trend on the XAU/USD is downward. On Friday, the price reached an important support level of 3246, below which there is a large accumulation of liquidity. The reaction to this level is bullish. At the moment, the intraday bias is in favor of buyers. Buying opportunities can be sought from the 3276 level, but with confirmation. The profit target is 3301. For selling, 3301 can be considered, but only if sellers take the initiative.
Scénario alternatif:if the price breaks through and consolidates above the resistance level of 3350, the upward trend will likely resume.

Fil d'actualité pour: 2025.06.30
- US Chicago PMI (m/m) at 16:45 (GMT+3).
Cet article reflète une opinion personnelle et ne doit pas être interprété comme un conseil en investissement, et/ou une offre, et/ou une demande persistante de réalisation d'opérations financières, et/ou une garantie, et/ou une prévision d'événements futurs.
