The EUR/USD currency pair
Technical indicators of the currency pair:
- Prev. Open: 1.1192
- Prev. Close: 1.1355
- % chg. over the last day: +1.46 %
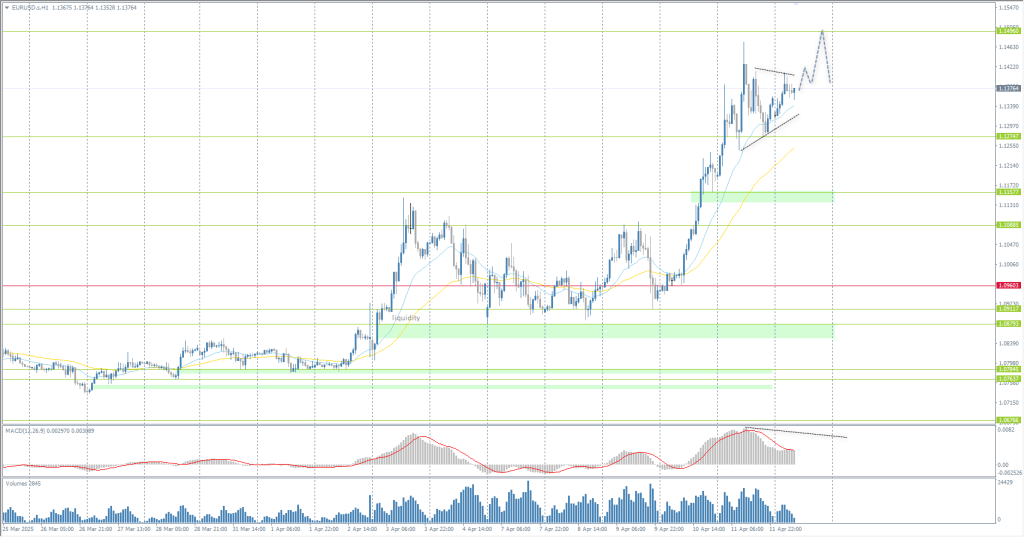
On Friday, the Dollar Index fell more than 1% to 99.2, the lowest level in almost three years, as investors continued to exit US assets. Escalating trade tensions and growing concerns about the broader economic fallout, especially for the US, weighed heavily on sentiment. The dollar weakened mostly against the euro and yen, and fell to a 14-year low against the Swiss franc. The euro continued its rally, breaking above $1.14 for the first time since late January 2022.
Trading recommendations
- Support levels: 1.1275, 1.1157, 1.1088, 1.0960
- Resistance levels: 1.1496
The EUR/USD currency pair’s hourly trend is bullish. The euro has consolidated above 1.1275, which opened space for growth up to 1.1496. It is recommended to consider the EMA lines or the support level of 1.1275 for buying. There are no optimal entry points for selling now. Most likely, when reaching 1.1500, fixation of previously opened positions will take place, which will lead to a correction wave and formation of a broadly volatile flat.
Alternative scenario:if the price breaks the support level of 1.0960 and consolidates below it, the downtrend will likely resume.

No news for today
The GBP/USD currency pair
Technical indicators of the currency pair:
- Prev. Open: 1.2967
- Prev. Close: 1.3079
- % chg. over the last day: +0.86 %
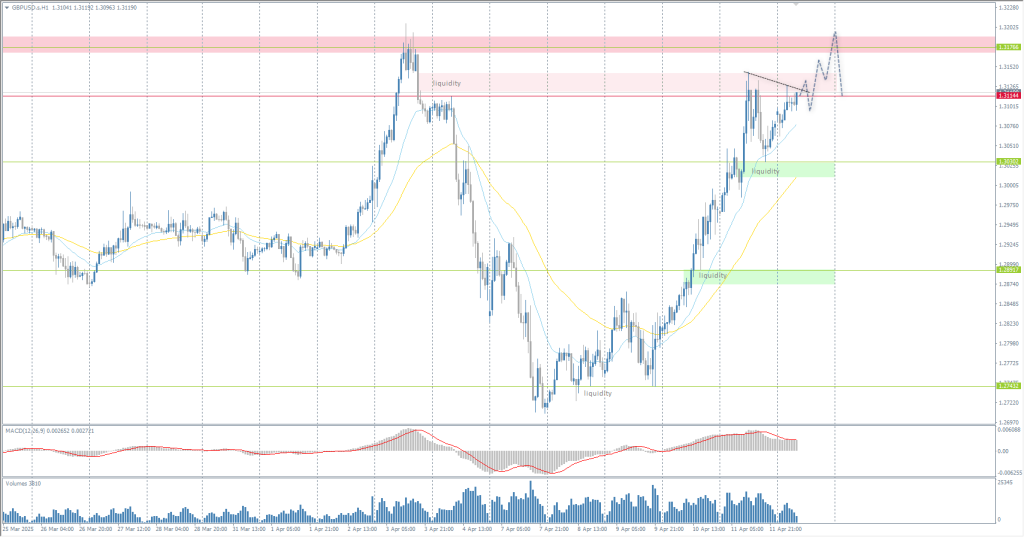
The British pound rose above $1.31, approaching a six-month high of $1.32 on April 3, after UK GDP surprised with a 0.5% growth rate in February, five times the expected pace. All major sectors contributed, with higher factory output hinting at stockpiling ahead of Trump’s aggressive new tariff measures. The good data has caused traders to slightly lower expectations of an imminent Bank of England rate cut, although three-quarter-point rate cuts are still priced in for 2025. Sterling also benefited from a weaker dollar as investors reacted to the intensifying trade war between the US and China.
Trading recommendations
- Support levels: 1.3030, 1.2891, 1.2743
- Resistance levels: 1.3114, 1.3176
From the point of view of technical analysis, the trend on the GBP/USD currency is bearish, but it will change soon. Sterling is sticking to the 1.3114 priority change level. Volumes are declining, and sellers’ reaction to each new test is weaker than the previous one. Such price action increases the probability of further price growth to 1.3176. It is better to consider buy trades from the EMA lines or from the support level of 1.3030. For sales, it is worth looking at the resistance zone above 1.3176, but with confirmation.
Alternative scenario:if the price breaks the resistance level of 1.3114 and consolidates above it, the uptrend will likely resume.

No news for today
The USD/JPY currency pair
Technical indicators of the currency pair:
- Prev. Open: 144.49
- Prev. Close: 143.51
- % chg. over the last day: -0.68 %
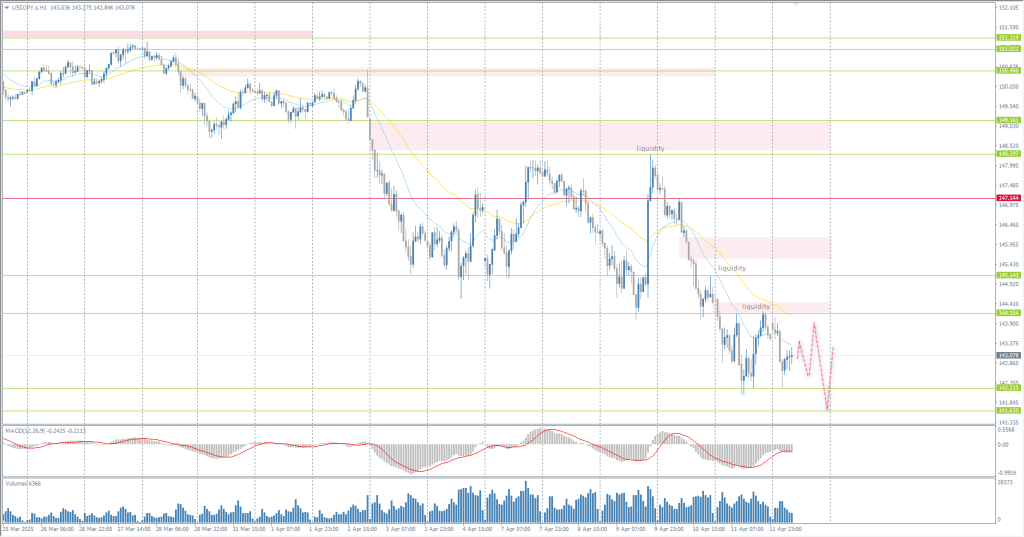
The Japanese yen strengthened to 142.2 against the US dollar, reaching its highest level since late September 2024, as escalating trade tensions between Washington and Beijing caused widespread dollar weakness and fueled demand for safe-haven assets. A simultaneous sell-off in US Treasuries, which are generally considered a hedge against uncertainty, has further boosted the yen. Meanwhile, markets are also keeping a close eye on trade talks between the US and Japan. Tokyo currently enjoys preferential tariffs of 10%, and Tokyo is pushing for more favorable terms in the negotiations.
Trading recommendations
- Support levels: 142.21, 141.63, 140.45
- Resistance levels: 144.15, 145.14, 147.14
From a technical point of view, the medium-term trend of the USD/JPY currency pair is bearish. The yen reached the support level of 142.20, where buyers showed a moderate reaction. This led to the formation of a flat with the boundaries 142.21–144.15. According to the flat rules, it is better to sell from the upper boundary and buy from the lower one. However, for buyers, it is worth considering that the liquidity pool is below 141.63, which increases the probability of a test of this level.
Alternative scenario:if the price breaks through the resistance level at 147.14 and consolidates above it, the uptrend will likely resume.

News feed for: 2025.04.14
- Japan Industrial Production (m/m) at 07:30 (GMT+3).
The XAU/USD currency pair (gold)
Technical indicators of the currency pair:
- Prev. Open: 3177
- Prev. Close: 3238
- % chg. over the last day: +1.92 %
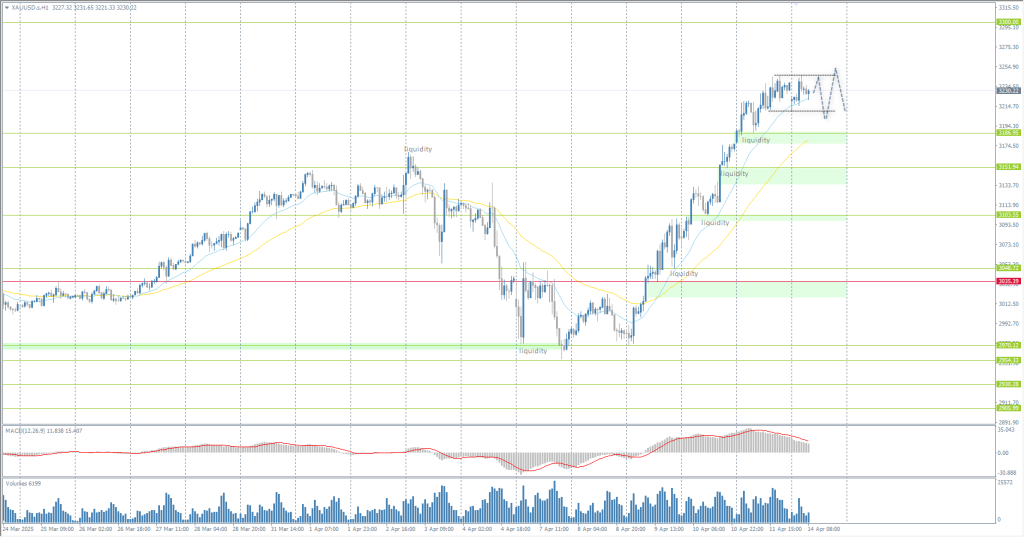
Gold climbed above $3250 per ounce on Friday, a new record, thanks to a weaker US dollar and increased demand for safe-haven commodities after the trade war between the US and China further escalated. China raised its tariffs against the US to 125% from April 12 and said it would ignore further US retaliatory measures after a series of tariff hikes by the White House to 145%. The current measures are set to affect about $700 billion in goods exchanged annually between the world’s largest economies, weakening risk assets tied to global growth and supporting the flow of funds to safe-haven countries.
Trading recommendations
- Support levels: 3186, 3152, 3103, 3048, 3035
- Resistance levels: 3300
From the point of view of technical analysis, the trend on the XAU/USD is bullish. Gold strengthened sharply on Friday, reaching new historical highs and exceeding all bank expectations that were heard before. The price is now starting to flatten near the EMA lines to accumulate liquidity. It is worth considering the EMA lines or the support level of 3186 for buying. Selling should not be rushed, as we need to see liquidity capture with the sellers’ reaction for a reversal.
Alternative scenario:if the price breaks and consolidates below the support level of 3035, the downtrend will likely resume.

No news for today
This article reflects a personal opinion and should not be interpreted as an investment advice, and/or offer, and/or a persistent request for carrying out financial transactions, and/or a guarantee, and/or a forecast of future events.
