The EUR/USD currency pair
Technical indicators of the currency pair:
- Prev. Open: 1.1395
- Prev. Close: 1.1514
- % chg. over the last day: +1.04 %
The euro rose to $1.15, its strongest level since November 2021, helped by a weaker dollar amid growing concerns about the Fed’s independence. The changes followed remarks from President Trump and the director of the US National Economic Council, who suggested that Trump was still “studying” firing Fed Chairman Powell. The euro gained more than 5% against the dollar during April as investors increasingly question the dollar’s dominance in the global financial system and turn to the single currency as an alternative.
Trading recommendations
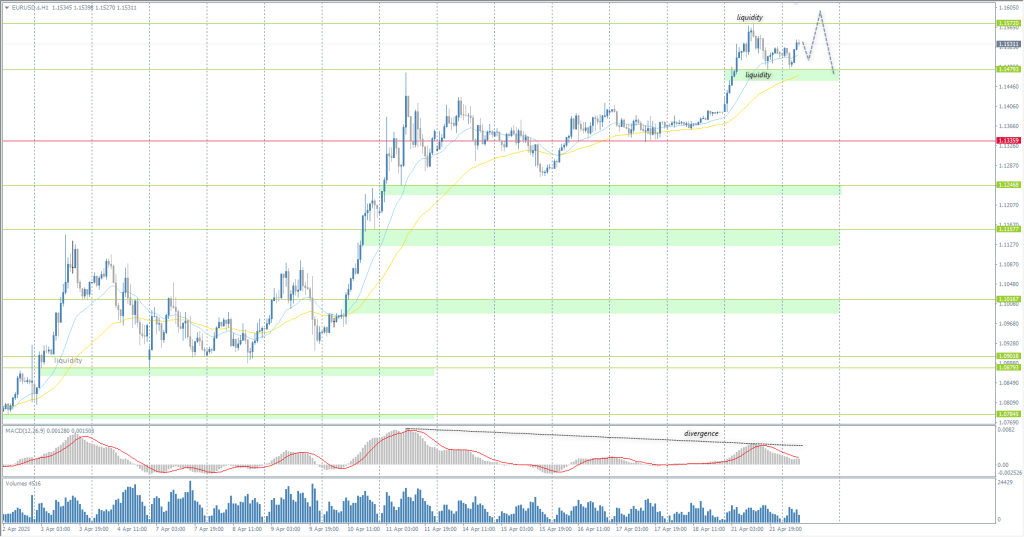
- Support levels: 1.1496, 1.1246, 1.1157, 1.1088, 1.0960
- Resistance levels: 1.1572
The EUR/USD currency pair’s hourly trend is bullish. The euro is trading in a sideways phase at the level of EMA lines. The bias remains for the bulls, but the price has reached an important liquidity pool above 1.1479. Given the MACD divergence, there is a high probability of a technical correction. For buying, it is better to use the support level of 1.1496 or EMA lines. For sell deals we can consider the level of 1.1572, but with confirmation in the form of the sellers’ initiative.
Alternative scenario:if the price breaks the support level of 1.1335 and consolidates below it, the downtrend will likely resume.

News feed for: 2025.04.22
- Eurozone ECB President Lagarde Speaks at 17:00 (GMT+3);
- US Richmond Manufacturing Index (m/m) at 17:00 (GMT+3).
The GBP/USD currency pair
Technical indicators of the currency pair:
- Prev. Open: 1.3276
- Prev. Close: 1.3378
- % chg. over the last day: +0.76 %
The British pound rose above $1.33, the highest in seven months, mainly due to the weakening US dollar. This is the longest rise since July 2020. It has risen about 4.5% in that time. This week, the UK will release its preliminary April PMI Index. The index came in at 51.5 in March, the highest reading since last October. The PMI for services reached 52.5 in March, the best reading since August last year.
Trading recommendations
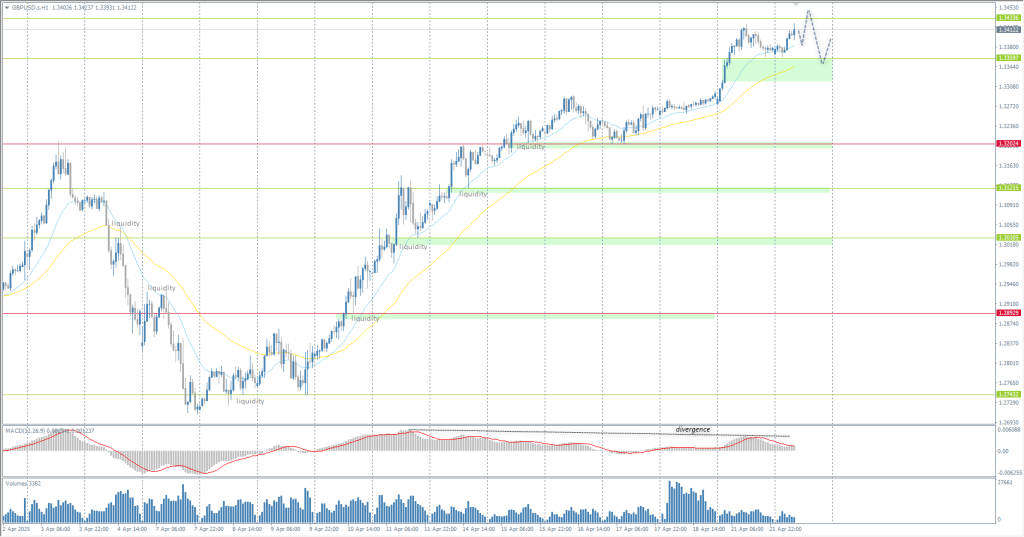
- Support levels: 1.3360, 1.3202, 1.3121, 1.3030, 1.2891, 1.2743
- Resistance levels: 1.3434
In terms of technical analysis, the trend on the currency pair GBP/USD on the hourly time frame is bullish. The bias also remains behind the bulls. The price seeks to test the liquidity above 1.3434. Given the MACD divergence, a technical correction within the uptrend is possible here. However, for selling, we need to see the sellers’ reaction to liquidity. For buying, we can consider the support level of 1.3360, but also with confirmation.
Alternative scenario:if the price breaks the resistance level of 1.3202 and consolidates above it, the uptrend will likely resume.

No news for today
The USD/JPY currency pair
Technical indicators of the currency pair:
- Prev. Open: 142.08
- Prev. Close: 140.88
- % chg. over the last day: -0.85 %
The Japanese yen climbed to 140.5 per dollar on Tuesday, hitting a seven-month high, as investors seek safety amid global trade tensions and growing skepticism about US assets. Domestically, attention shifts to next week’s Bank of Japan meeting. While the Central Bank is expected to keep its benchmark rate unchanged at 0.5%, it may lower its economic growth projections in light of rising external risks, particularly the impact of tariffs imposed by the US on Japan’s export-heavy economy.
Trading recommendations
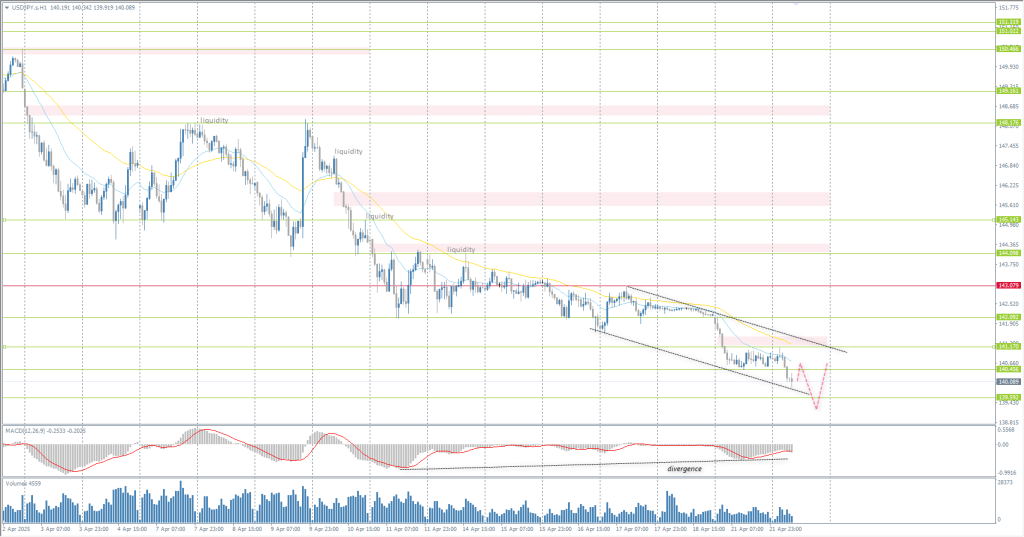
- Support levels: 139.59
- Resistance levels: 140.45, 141.17,142.09, 143.08
From a technical point of view, the medium-term trend of the USD/JPY currency pair is bearish. The bias also remains behind the bears. The price is now aiming to test the liquidity pool below 139.59. Given the MACD divergence, a technical correction is possible here. The resistance level of 140.45 can be used for selling. For buying, we need to see the reaction of buyers to the liquidity below 139.59.
Alternative scenario:if the price breaks through the resistance level at 143.08 and consolidates above it, the uptrend will likely resume.

No news for today
The XAU/USD currency pair (gold)
Technical indicators of the currency pair:
- Prev. Open: 3331
- Prev. Close: 3424
- % chg. over the last day: +2.79 %
Gold surpassed $3480 per ounce on Tuesday, setting a new record, driven by risk aversion amid growing economic uncertainty. The US dollar fell to a three-year low after President Trump increased pressure on the Federal Reserve, calling for aggressive rate cuts and reportedly considering the resignation of Fed Chairman Powell. Fears of political interference in monetary policy have undermined confidence in the dollar.
Trading recommendations
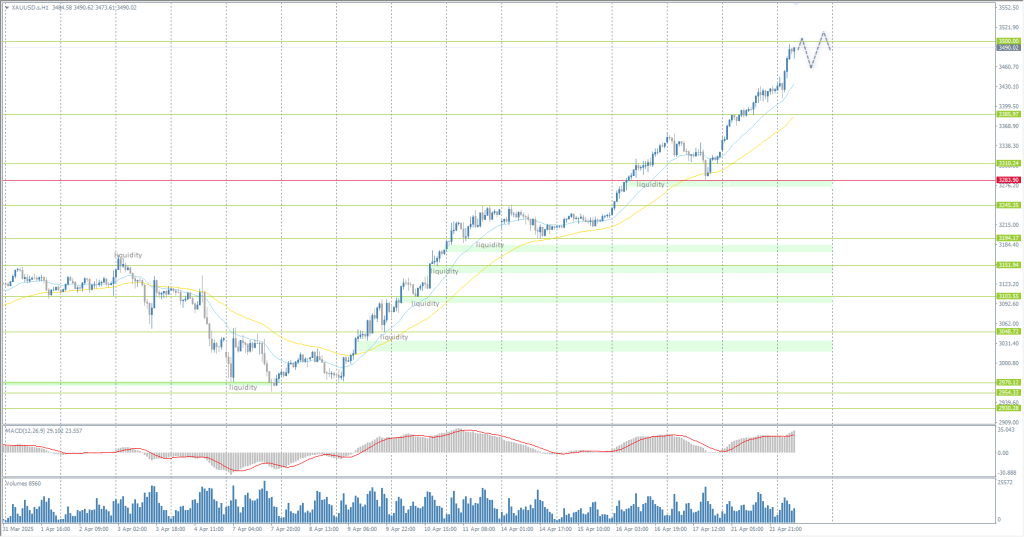
- Support levels: 3386, 3310, 3283, 3245, 3194
- Resistance levels: 3500
From the point of view of technical analysis, the trend on the XAU/USD is bullish. Gold continued to rally even in a thin market. This morning, the price rallied towards the psychological level of 3500. Banking experts do not have time to update their expectations on gold, as it is already breaking another maximum level. It is not recommended to sell, as sellers are not observed in the market. To buy, we should wait for a correction to the EMA lines.
Alternative scenario:if the price breaks and consolidates below the support level of 3283, the downtrend will likely resume.

News feed for: 2025.04.22
- Eurozone ECB President Lagarde Speaks at 17:00 (GMT+3);
- US Richmond Manufacturing Index (m/m) at 17:00 (GMT+3).
This article reflects a personal opinion and should not be interpreted as an investment advice, and/or offer, and/or a persistent request for carrying out financial transactions, and/or a guarantee, and/or a forecast of future events.
