Locked-in Range Analysis (LRA) is a market analysis methodology that identifies price ranges where market participants are “trapped” in inefficient or losing positions. The core idea is to pinpoint moments when most traders are stuck and to use this imbalance as a springboard for forecasting directional price movement.
1. The Core Concept
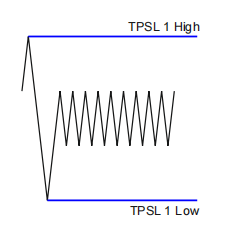
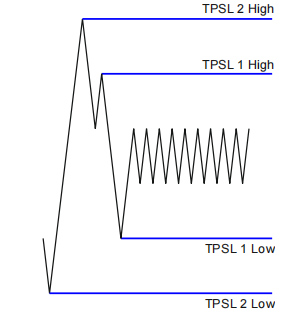
LRA revolves around the idea of a “locked-in range”, a price zone where significant position accumulation has occurred. Still, the market has failed to continue in the anticipated direction and remains in a flat, consolidating state. When the price finally breaks out of this range, a wave of forced exits, stop-loss triggers, and position closures propels the market in the breakout direction.
Key logic of LRA:
- Traders hold positions inside the range, expecting a breakout in a specific direction.
- When the price breaks out in the opposite direction, losing traders are forced to close their positions, fueling the move.
- This creates forced liquidity, which provides a high-probability opportunity for entry in the breakout direction.
2. Constructing the Range
A valid range typically appears on hourly and higher timeframes. It forms after directional movement and reflects a period of consolidation, characterized by declining volatility, increasing volume inside the range, and repeated returns to a mid-zone.
A range is considered “locked-in” if:
- There was a notable accumulation of positions within it.
- The market stayed inside the range for a prolonged period.
- There are clear price levels above and below the range where stops and targets are likely concentrated.
3. Entry Logic
Once a locked-in range is identified, the trader waits for the price to break out decisively. The breakout itself should not be merely a technical push, because it must show signs of real market imbalance and liquidation:
- Sharp momentum;
- Increased volume;
- Candlesticks with large bodies and minimal wicks.
Once confirmed: - Entry is made in the direction of the breakout.
- Stop-loss is placed inside the range (as a rule, below the middle of the range for buy deals and above the middle of the range for sell deals);
- Take-profit is set at 1.5–2× the range’s height or at support/resistance levels where liquidity imbalances may occur.
4. Advantages of LRA
Clear structure: The system offers straightforward entry and exit criteria based on logic, not guesswork.
- Exploits inefficiencies: Focuses on moments when most traders are wrong and forced to exit.
- Volume-friendly: Can be paired effectively with cluster analysis, volume profiles, or delta tools.
- Versatile: Works across intraday and swing trading setups.
5. Limitations and Risks
Despite its clarity, LRA has some important drawbacks:
- Misidentification of the range: Not every consolidation is a trap, and not every breakout is real.
- Assumptions of manipulation: The concept assumes that large players deliberately trap smaller ones, which oversimplifies market dynamics.
- Late confirmation: Often, the entry comes after the initial move, reducing the risk-reward ratio.
- Requires context: Without a broader understanding of the market trend, LRA may produce false signals.
6. Comparison of LRA With Market Activity Phases
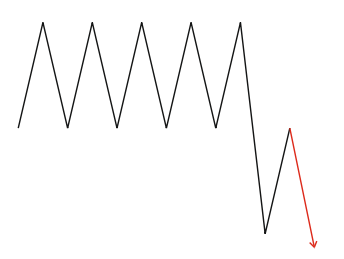
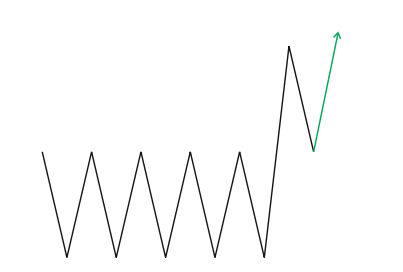
LRA shares many similarities with the methodology of market activity phases. In classical interpretation, there is a balance phase and an impulse phase. In the balance phase, market participants accumulate positions; the market is in balance, but there is no certainty. Then there is an impulse breakout of one of the balance boundaries, and the market enters the impulse phase (trend phase). In LRA methodology, the balance phase refers to the range of “locked” traders that occurs after the price leaves the range.
In both methodologies, entries are made in the direction of the breakout. In both methodologies, the preferred entry is after a range test.
You’ve seen this before, most likely.
7. The Correlation Between LRA and Volume
The number of open positions (which has a direct influence on price changes) depends on the traded volume and the amount of time spent within a single range. Without knowing the exact number of open positions within the price range and the number of positions closed after breaching the TPSL level, one can rely solely on an averaged volume exit scenario.
Volume breakout level:
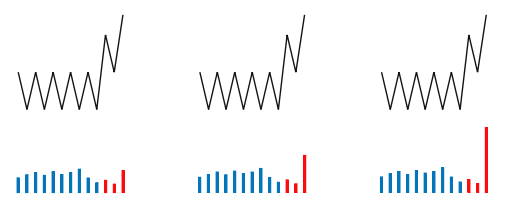
Depending on the trading goals and position holding time, market participants may prefer either a trend-following or flat trading approach.
- Trend Preference. Refers to the likelihood of a price reversal from the range upon return, based on the presence of trapped open positions. These positions are positioned against the dominant volume, making it advantageous for the market maker to quote or hold the price at that level.
- Flat Preference. Refers to the likelihood of the price returning to the range after breaking through TPSL levels. This is based on the absence or elimination (e.g., through triggered stop-losses) of a significant imbalance in open positions. Given the remaining volume, it may be advantageous for the market maker to adjust the price to execute break-even and/or stop-loss orders for the remaining profitable positions.
Practical Examples
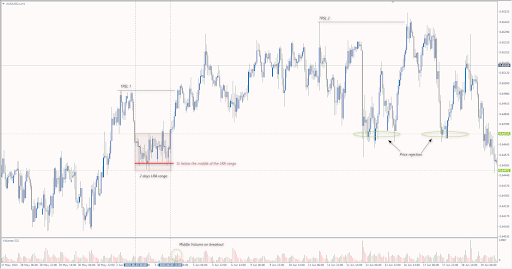 AUD/USD, H1
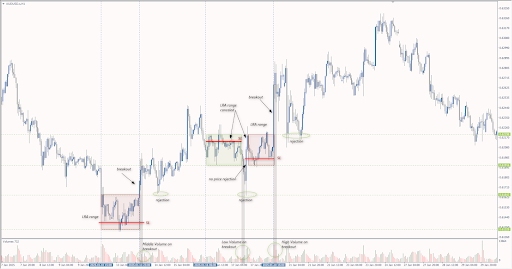 AUD/USD, H1
This strategy works particularly well on currency pairs, metals, and major indices, where retail traders are active and sensitive to key levels.
LRA Strategy Power
LRA is not a silver bullet. It’s a structured way to read the market through the lens of liquidity imbalances and crowd psychology. Its strength lies in identifying areas where others are already wrong and using that moment to your advantage.
That said, like any trading system, LRA requires:
- Confirmation from volume, candlestick behavior, or market structure;
- Backtesting and careful validation;
- Strict risk management.
For experienced traders, LRA can become a powerful filter or even a system core. For newer traders, it offers valuable insight into market behavior, especially how liquidity and psychology intersect at key price zones.

