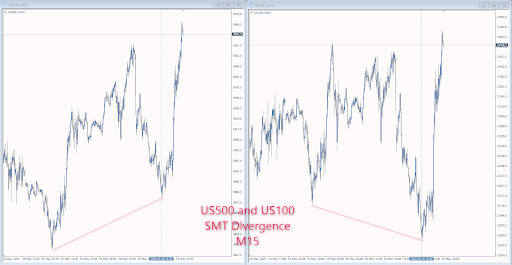
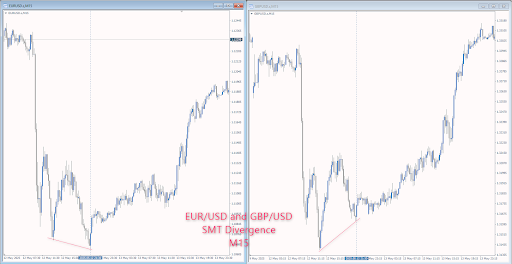
In the trading world, it is important to notice what others miss. One such advanced analysis tool is SMT-divergence (Smart Money Technique Divergence). This is a practical method that institutional traders and followers of the Smart Money concept actively use. Let’s understand what it is, how it differs from classical divergences, and how to look for such signals on the chart.
What Is SMT Divergence?
SMT-divergence (Smart Money Technique Divergence) is a divergence between the movements of two (or more) similar financial instruments, which indicates a possible reversal or weakening of the current trend. It is based on the idea that smart money does not leave traces directly, but its actions can be calculated by analyzing the behavior of related assets.
Simply put, if one instrument updates the maximum/minimum while another does not, something is “unclean,” and a reversal or correction is possible.
SMT divergence always compares 2 mutually correlated instruments, usually from the same asset class.
Example 1:
Suppose we have two indices: NASDAQ (US100) and S&P 500 (US500). Both instruments are mutually correlated and belong to the same asset class. Both are moving in roughly the same direction. However, the NASDAQ updates a local high at some point, while the S&P 500 does not. This is SMT divergence: the market shows that “something is wrong,” and a reversal will likely follow soon.

Example 2: SMT Divergence on EUR/USD and GBP/USD

Why Does It Work?
“Smart money” doesn’t always reveal its intentions directly. Sometimes, they “move” one instrument while leaving another unchanged to mislead the crowd. For example, the NASDAQ is moving stops up, but the S&P 500 is not supporting the move, meaning buyers are trapped, and a downward reversal is likely.
What is the difference between SMT divergence and classic indicator divergence?
Here are the key differences:
| SMT divergence | Indicator divergence |
| Compares two assets | Compare price and indicator (RSI, MACD, etc.). |
| Does not use indicators | Uses technical indicators |
| Reflects manipulation and “smart money” behavior | Industrial rebound, earnings optimism |
| Often more accurate | Can give many false signals |
What Tools Should I Use for SMT Divergence?
The best way to compare interconnected markets is to compare those that move in sync because they are subject to the same capital flows. Here are some popular pairs:
Indices:
- S&P 500 (US500) and NASDAQ (US100)
- Dow Jones (US30) and NASDAQ (US100)
Currencies:
- EUR/USD and GBP/USD
- EUR/JPY and USD/JPY
Bonds:
- US 10-Year (ZN) and US 30-Year (ZB)
Gold and Silver:
- XAU/USD and XAG/USD.
Choose pairs with high correlation, and then SMT divergence will be especially significant.
How Do You Look for SMT Divergence?
- Open the charts of two related assets (e.g., US500 and US100).
- Compare the local highs or lows over the same period.
Look for:
- One instrument makes a new high, but the other can’t. Or one makes a new low, and the other doesn’t.
- This is the potential SMT divergence — signaling a reversal or correction.
- Confirm the idea with volume, liquidity, and price behavior (Price Action).
What Time Frames Should I Look for SMT Divergence?
The timeframe you choose depends on your trading style, but SMT divergences generally work best on high-precision intraday and short-term trading. Here’s how to break it down by trader type:
Intraday (intraday trading)
- Time frames: M5, M15, M30
- Why: On these timeframes, SMT divergence often appears before the start of the session (especially before the American session). Regarding liquidity, it is a great place to enter an impulse move.
Swing Trading
- Time frames: H1, H4, D1
- Why: Here, SMT divergence can indicate the end of the accumulation/distribution phase and the emergence of a medium-term entry point. Works great on key liquidity zones.
- Example: EUR/USD makes a false breakout daily, but GBP/USD does not. This is a signal that the market is likely ready for a reversal.
Scalping
- Time frames: M1, M5
- Important: Only when there is a clear market structure, for example, during the opening of the London or New York session. Signals can be “noisy,” so confirmation from context is desirable.
Time frame tips:
- Never look for SMT divergence in “empty” space. It should be part of the big picture: near liquidity, at key extremums (high/low of the day, week), or after false breakouts/breakdowns.
- The best approach is a multi-frame approach. For example, H1 is used for context, and M15-M5 is used for entry.
- The higher the timeframe, the stronger the signal, but the less frequent the opportunities.
Warning!
SMT divergence is not the “holy grail.” It requires:
- experience in visual chart analysis,
- an understanding of market conditions,
- and preferably confirmation by other Smart Money tools: liquidity, imbalances, order blocks, etc.
Importance of SMT-Divergence
SMT-divergence is a powerful tool in the arsenal of traders oriented on Smart Money logic. Unlike indicator signals, it allows you to see deep divergences in the market structure. If you learn to see it, it can become your competitive advantage.

